

Score Cut Points
Pediatric & Parent Proxy
PROMIS Pediatric & Parent Proxy Measures
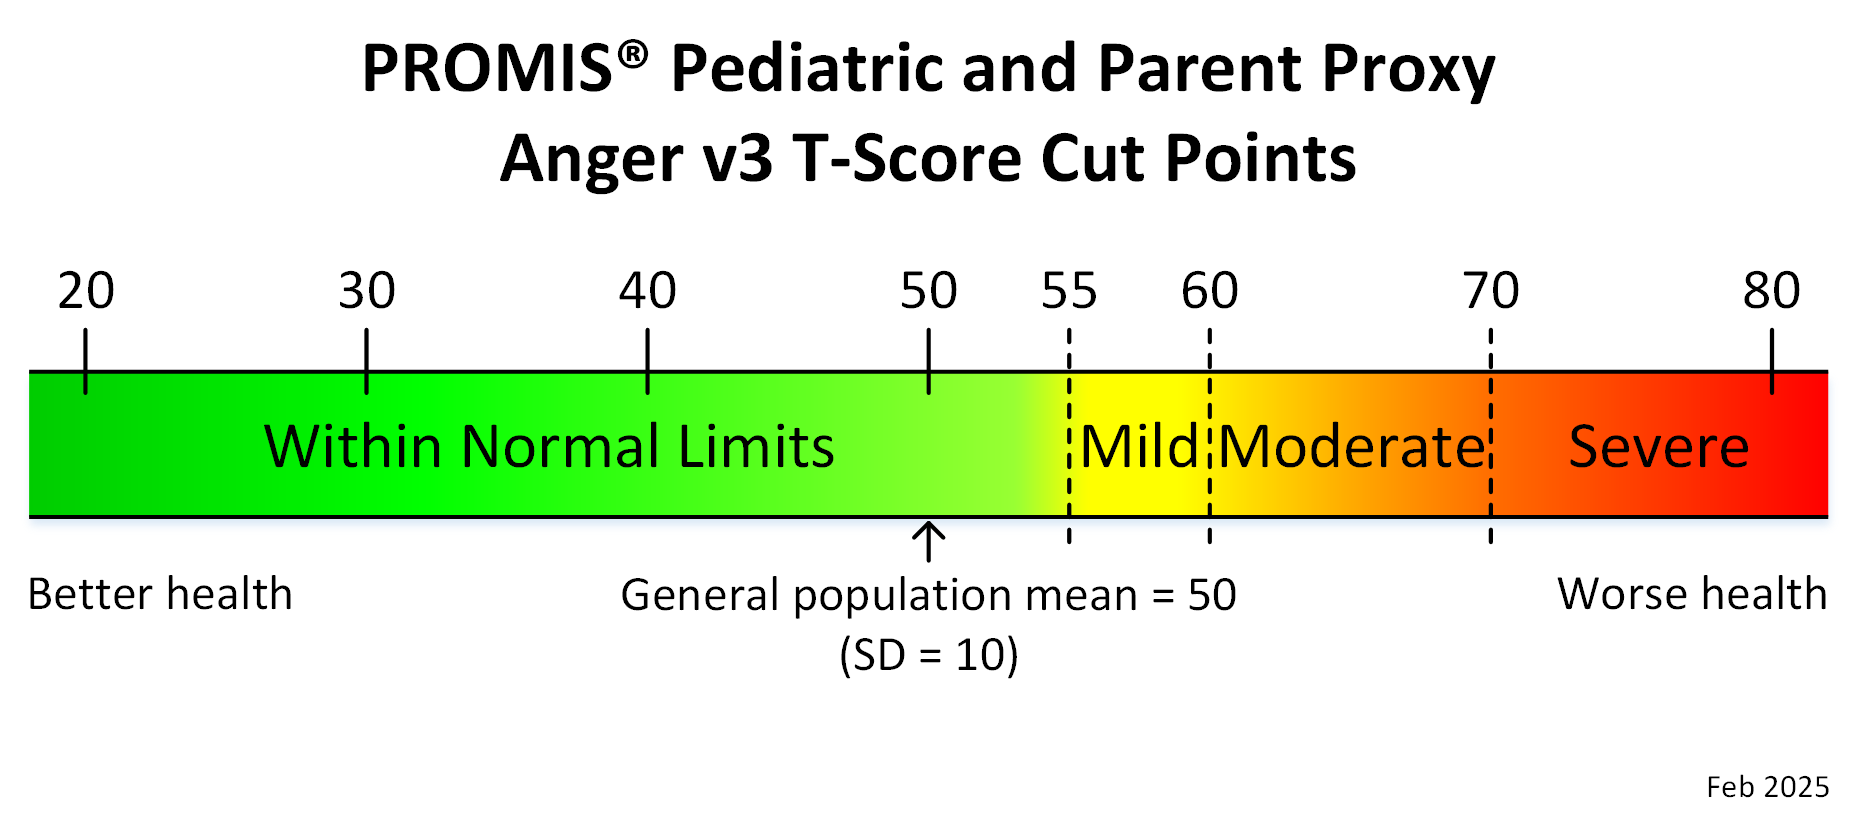
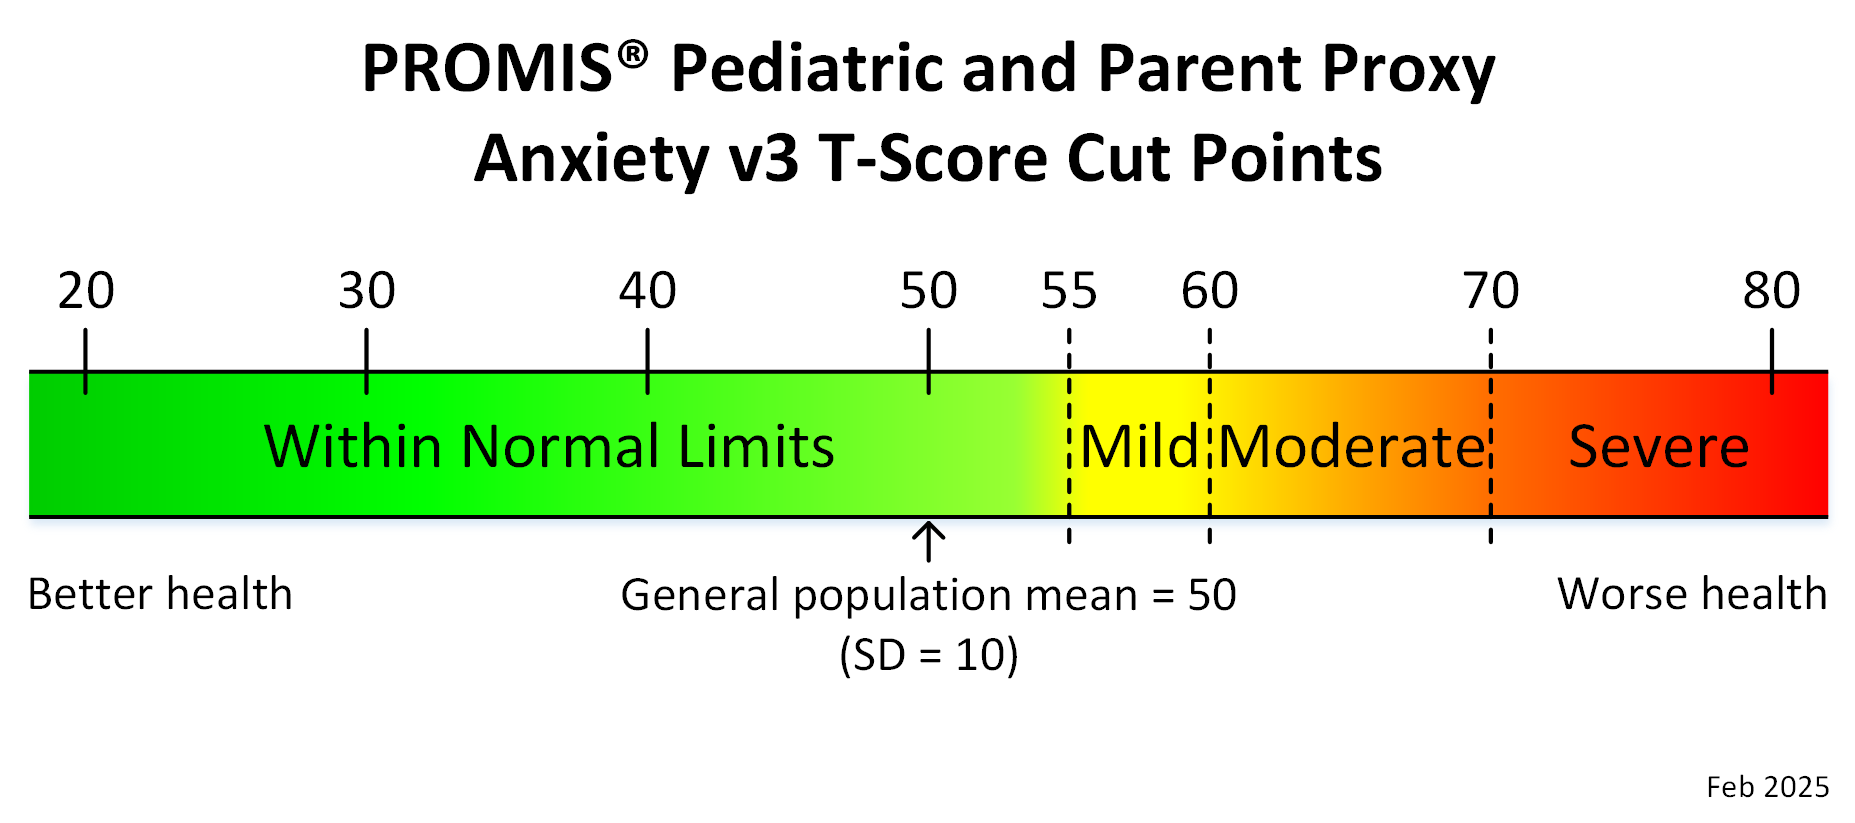
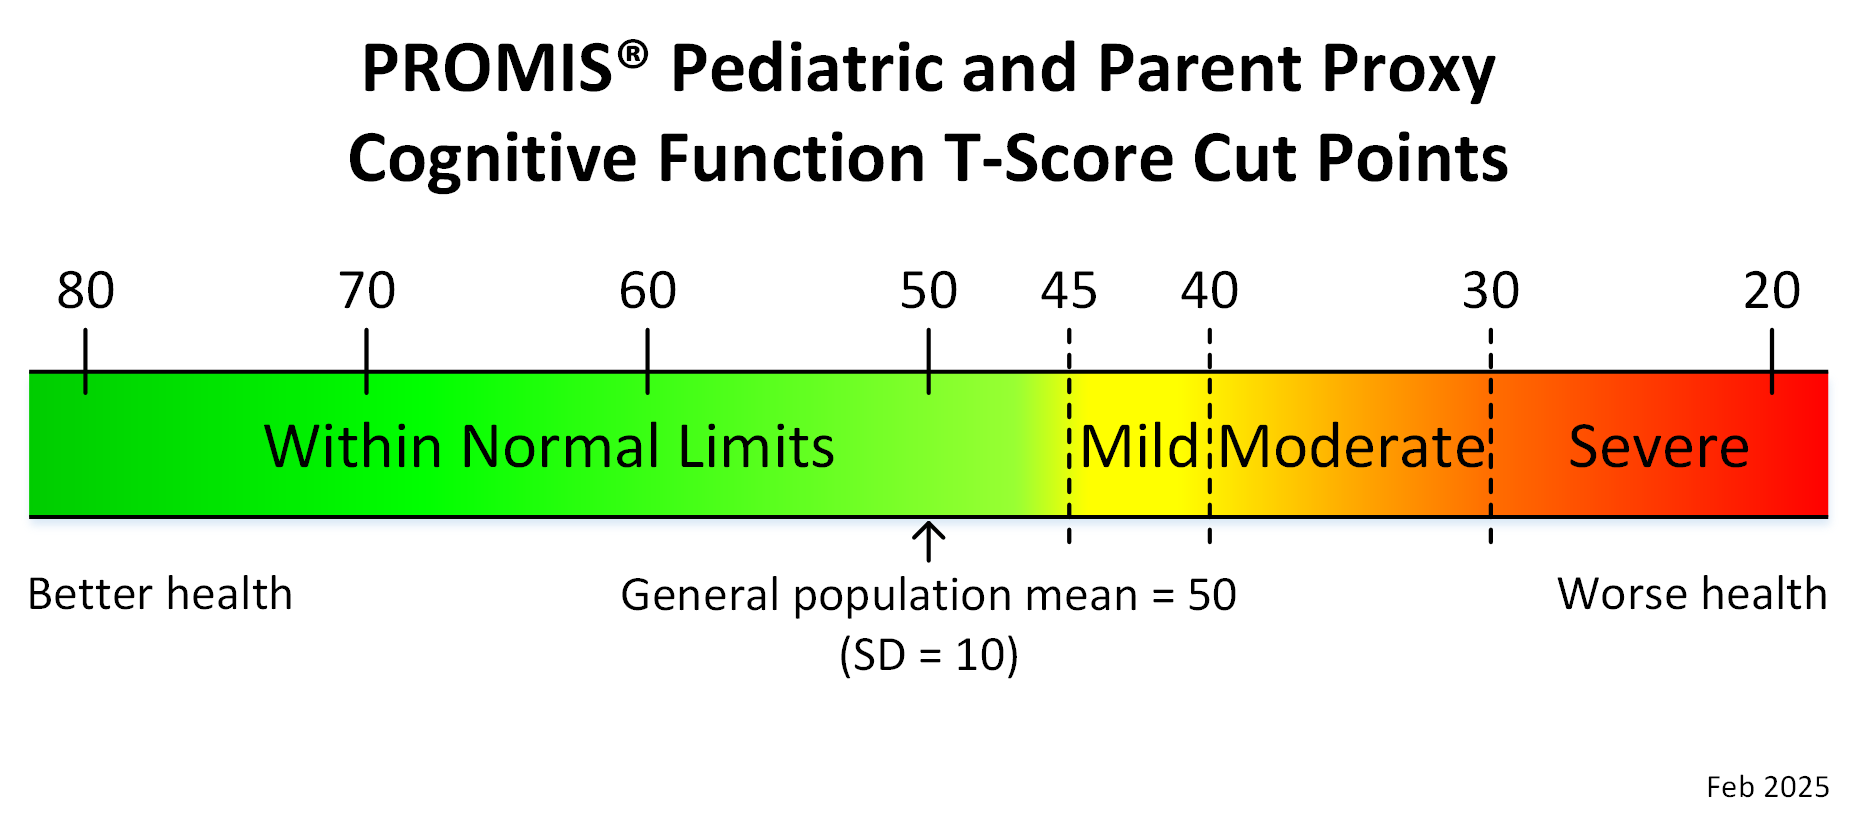
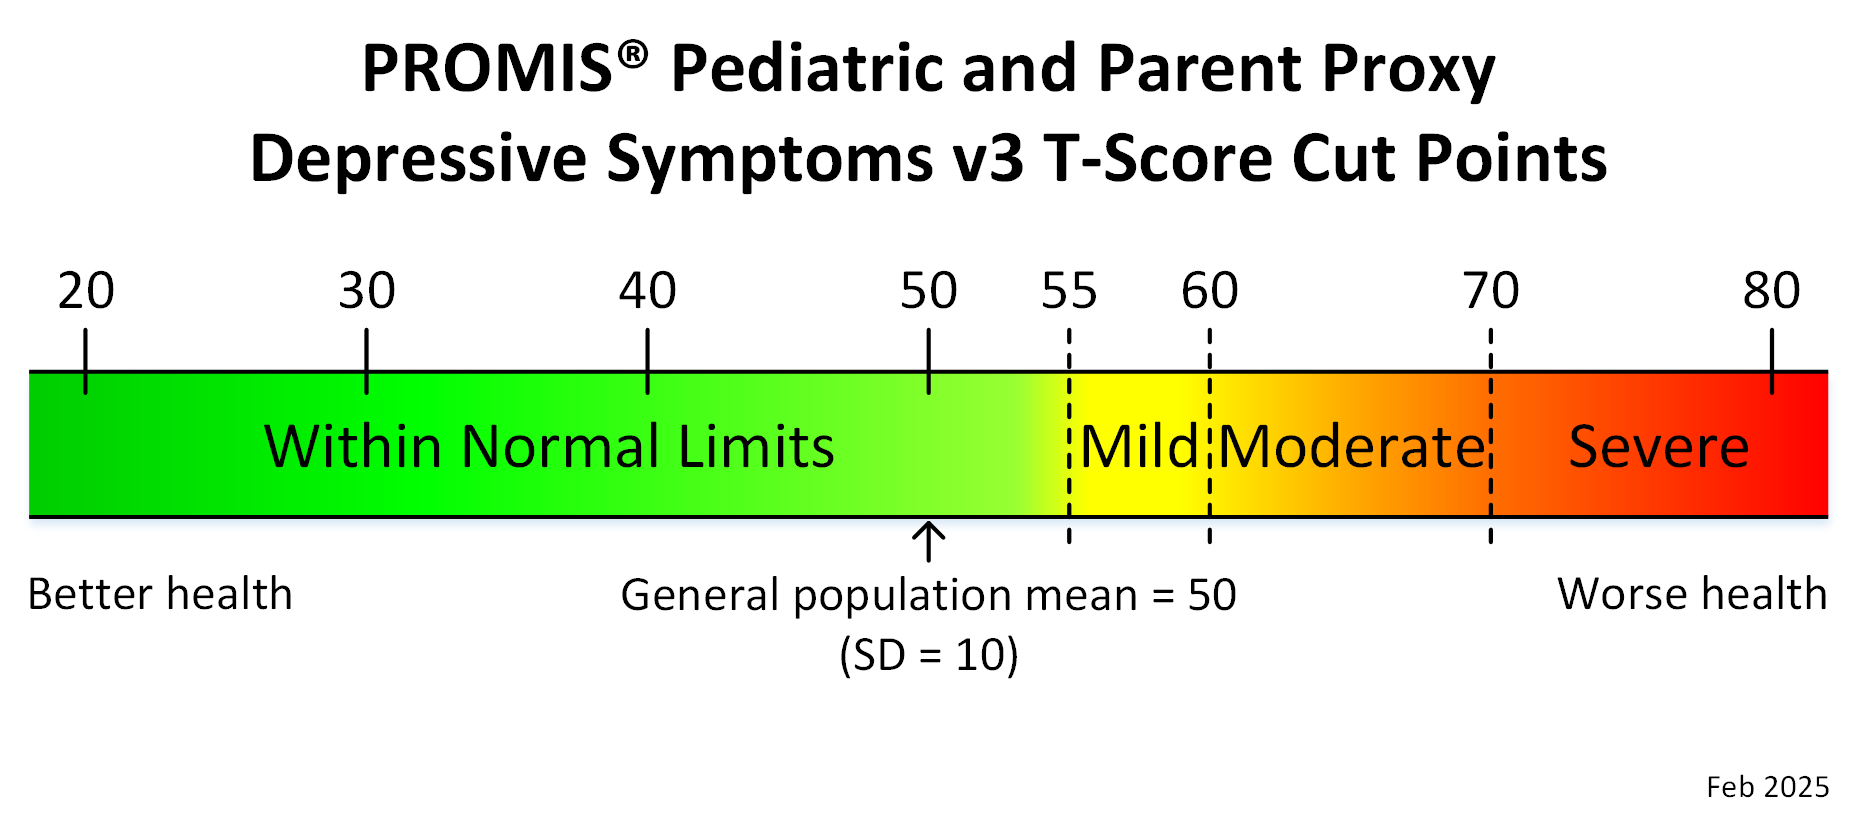
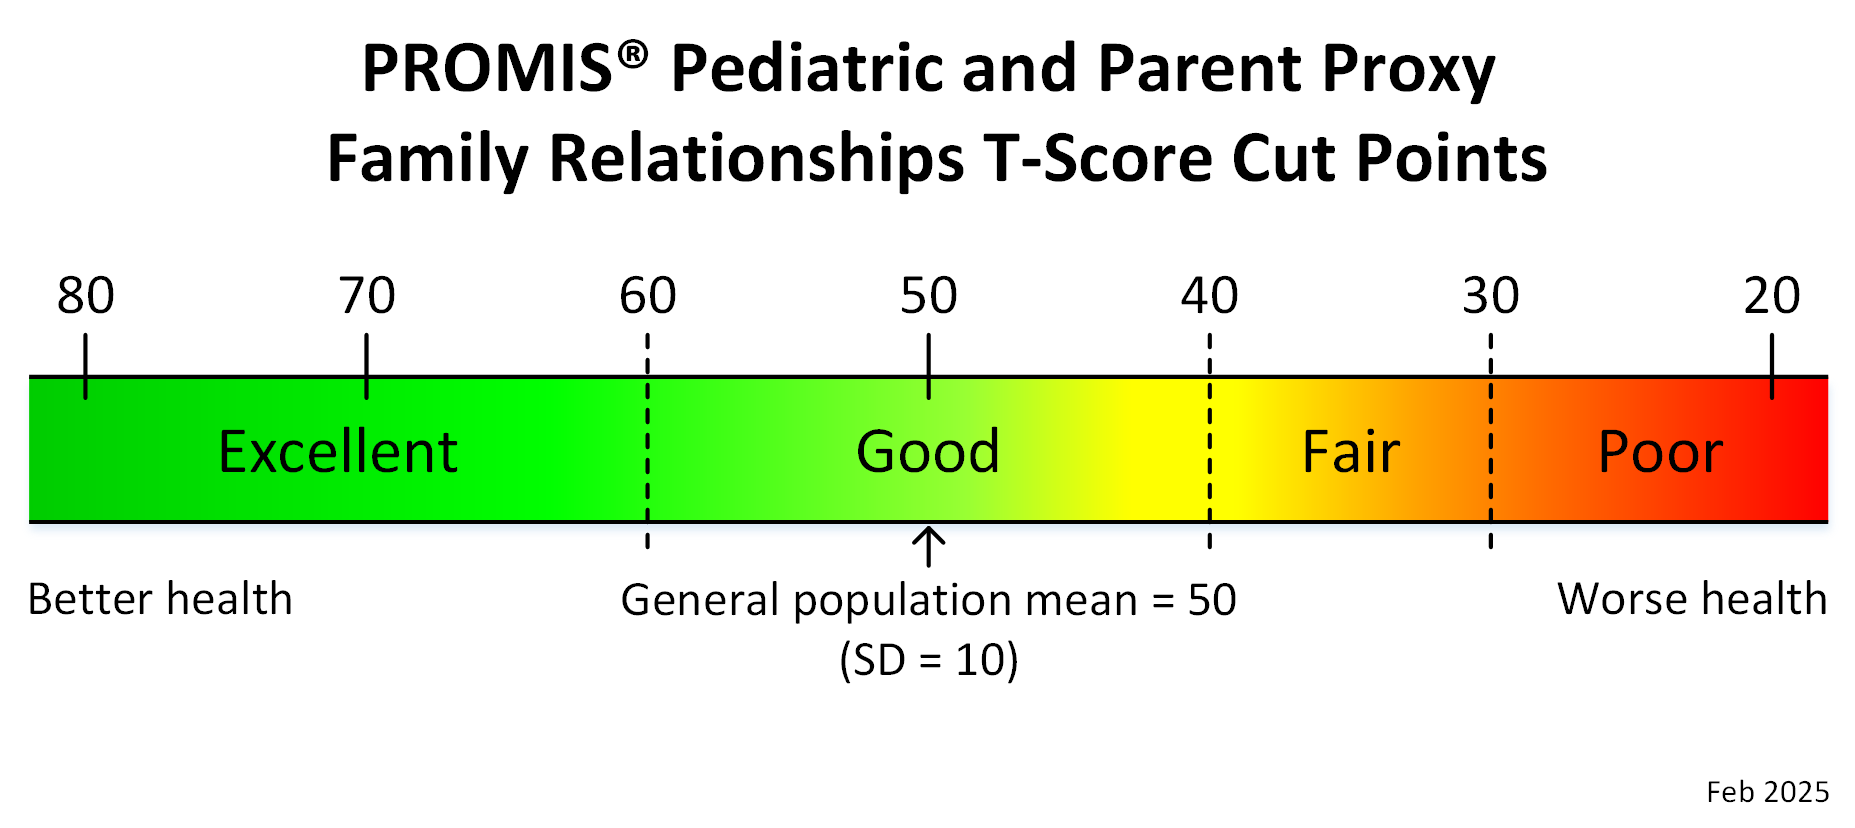
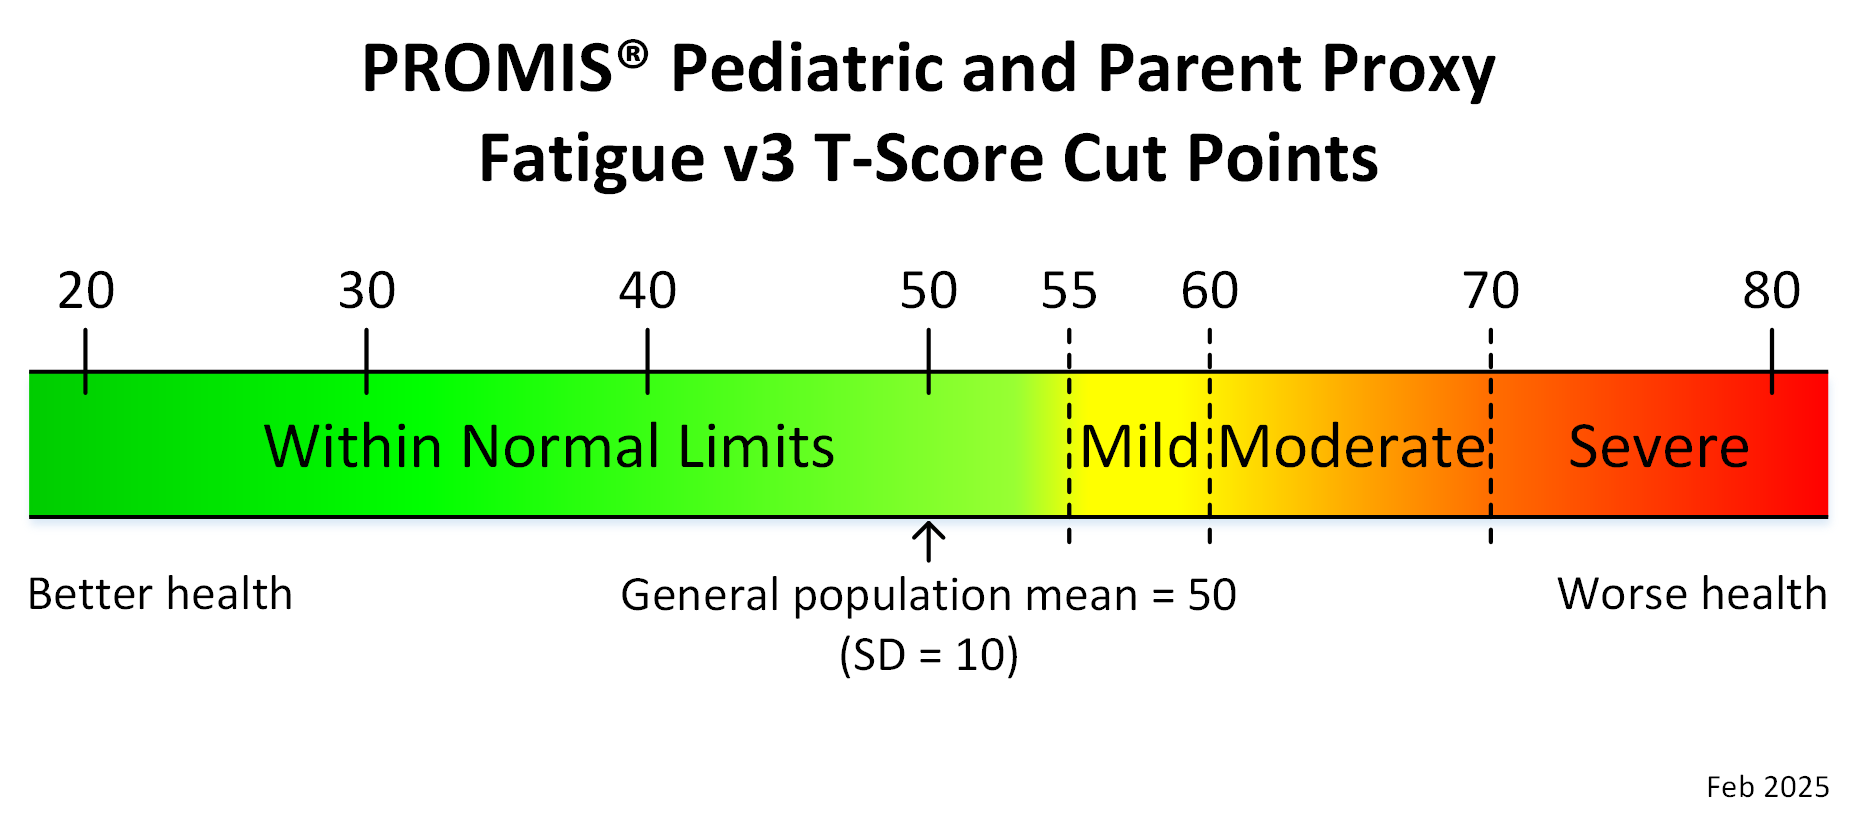
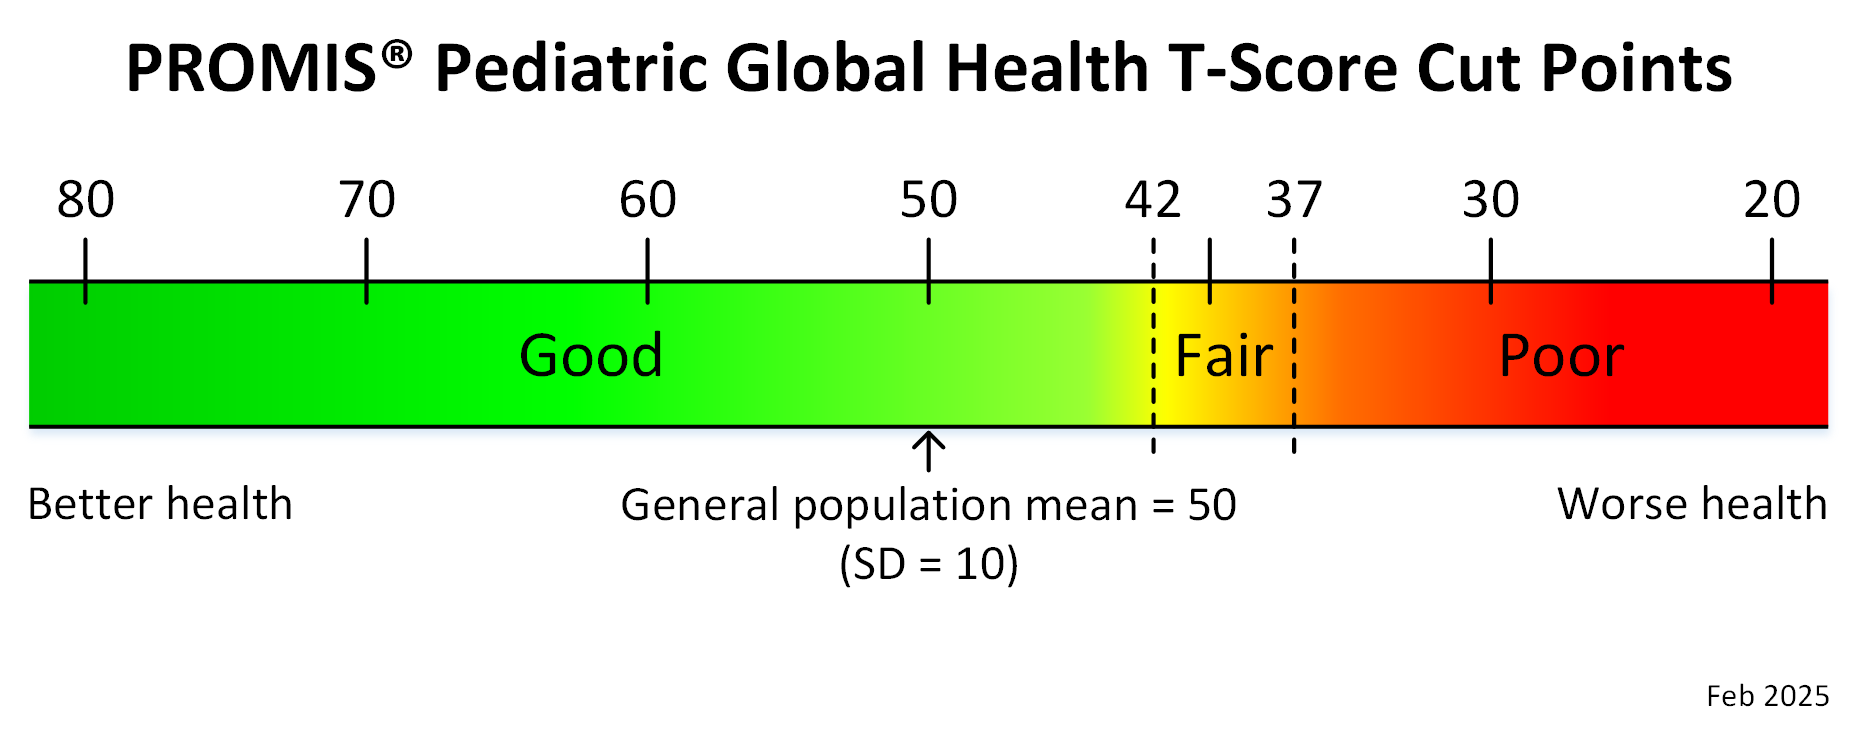
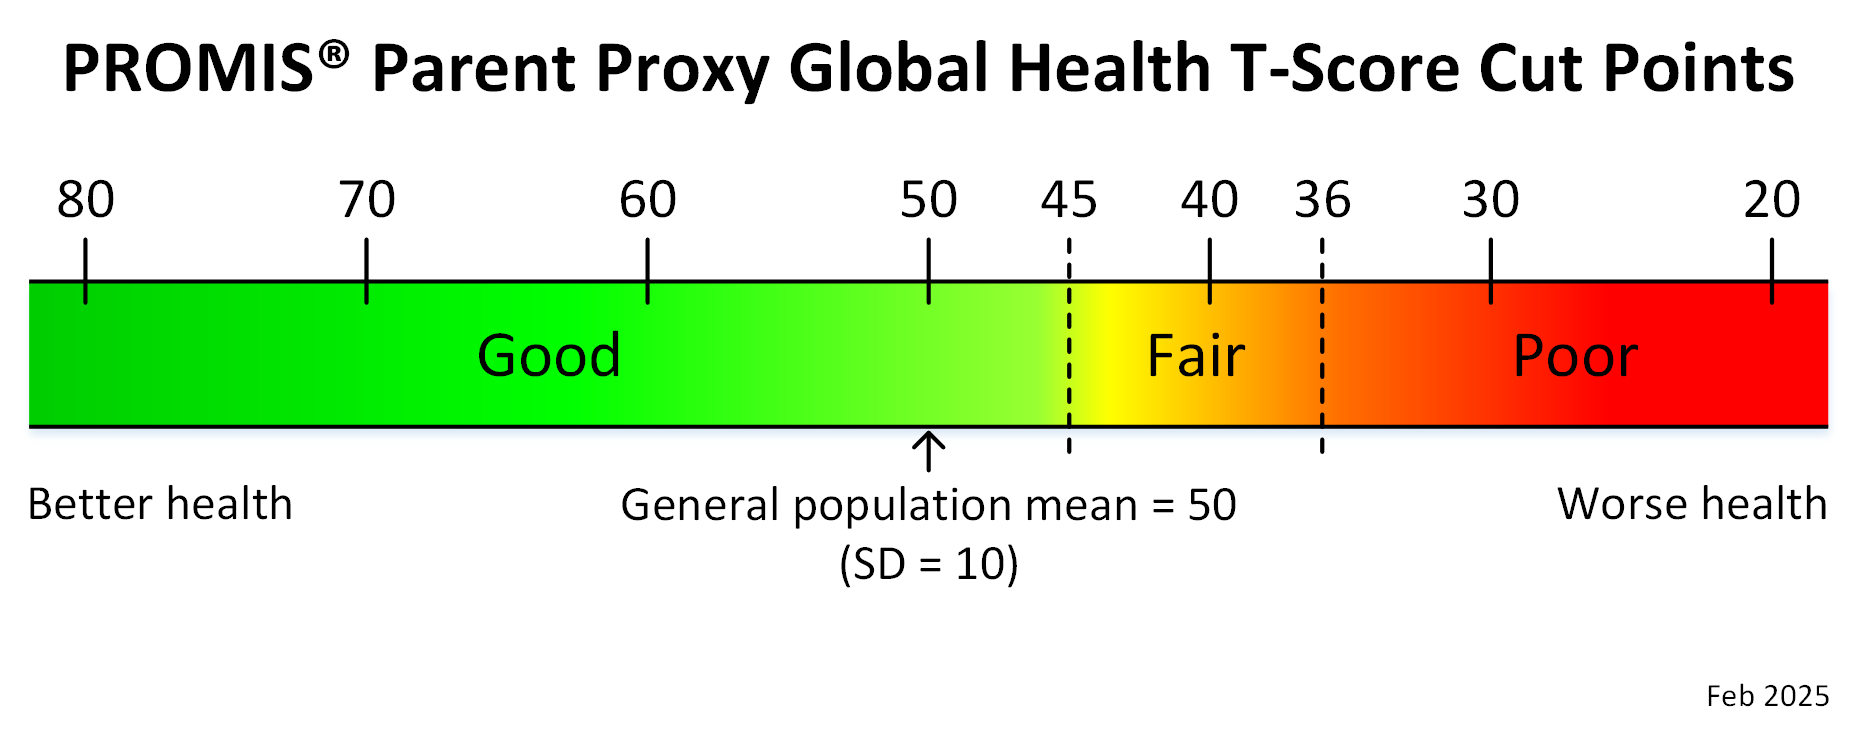
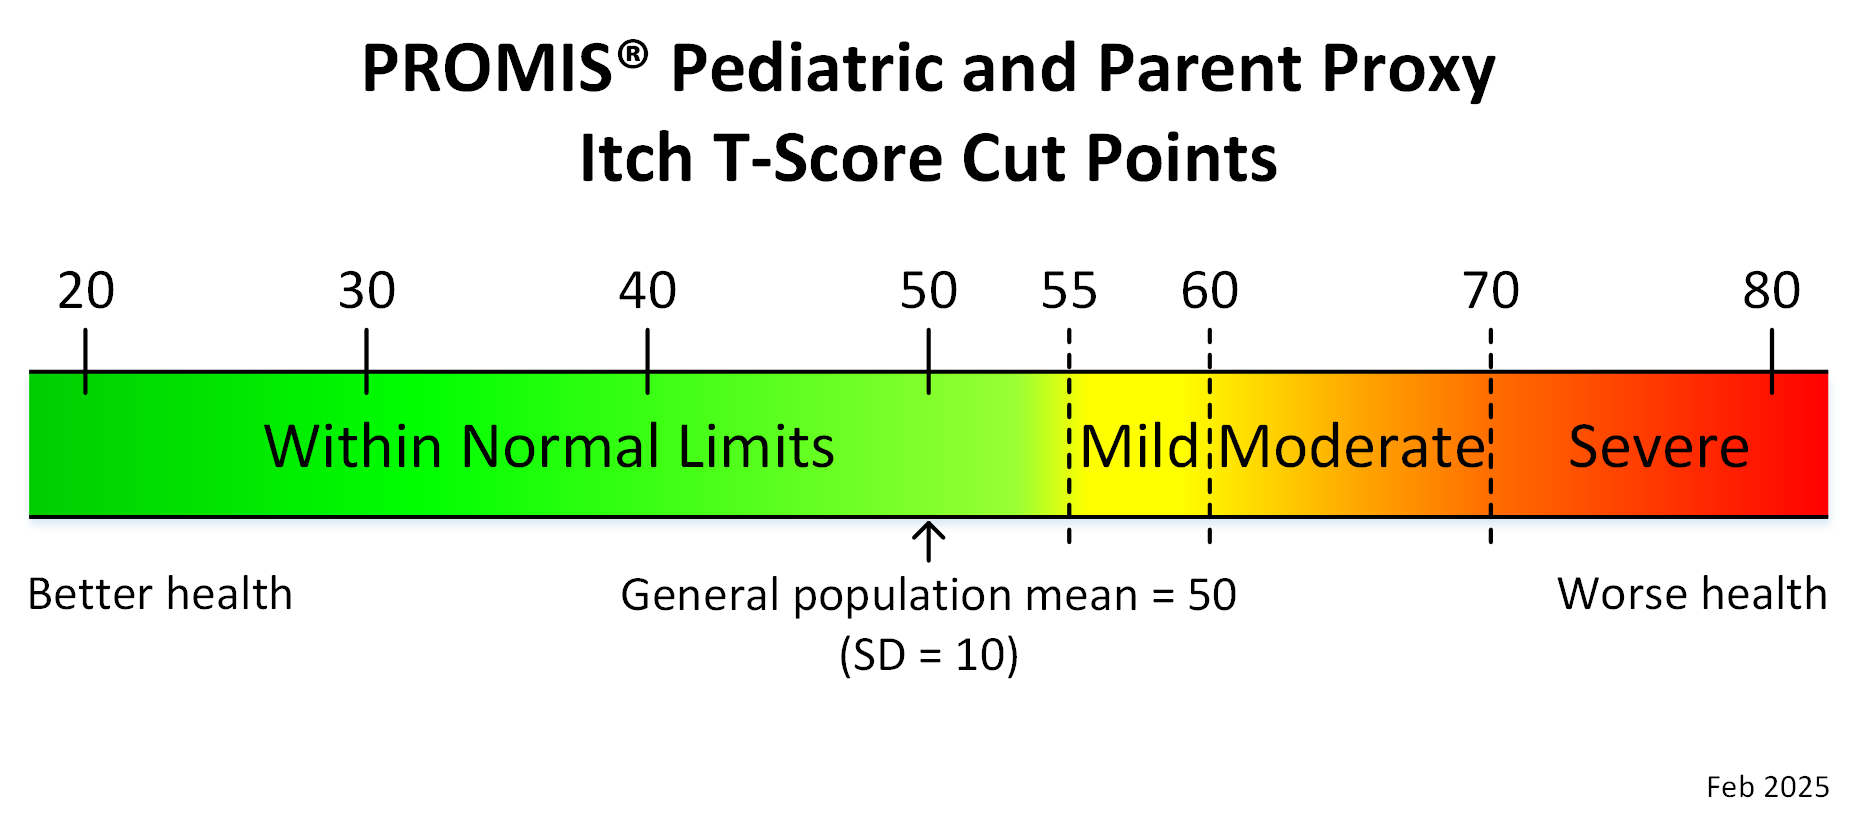
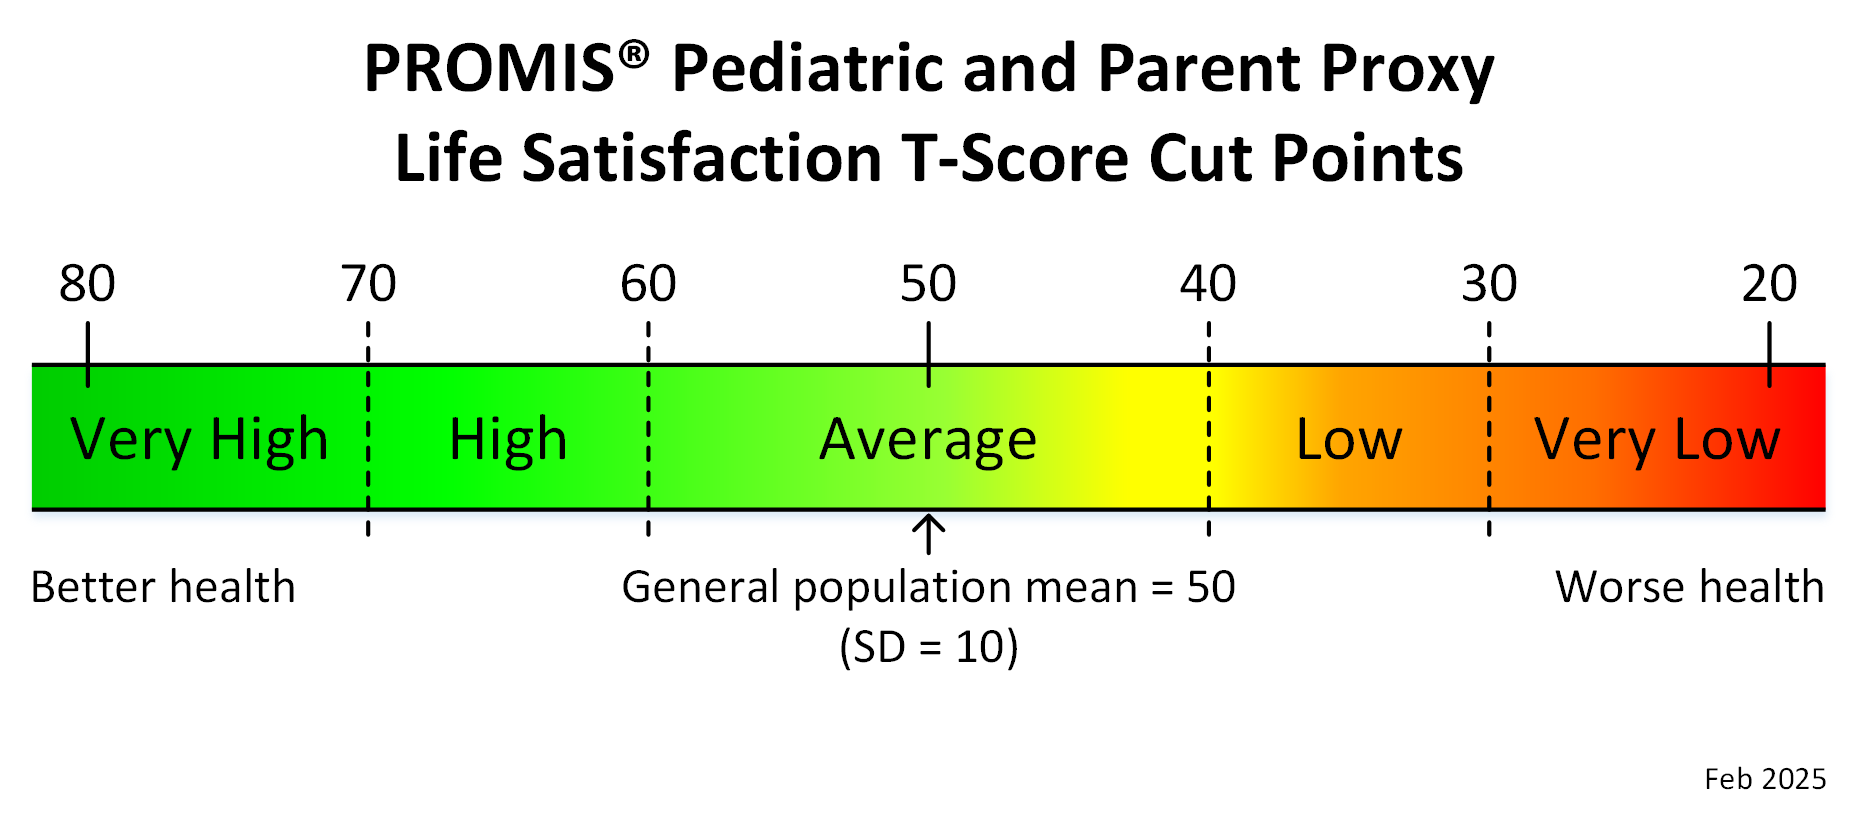
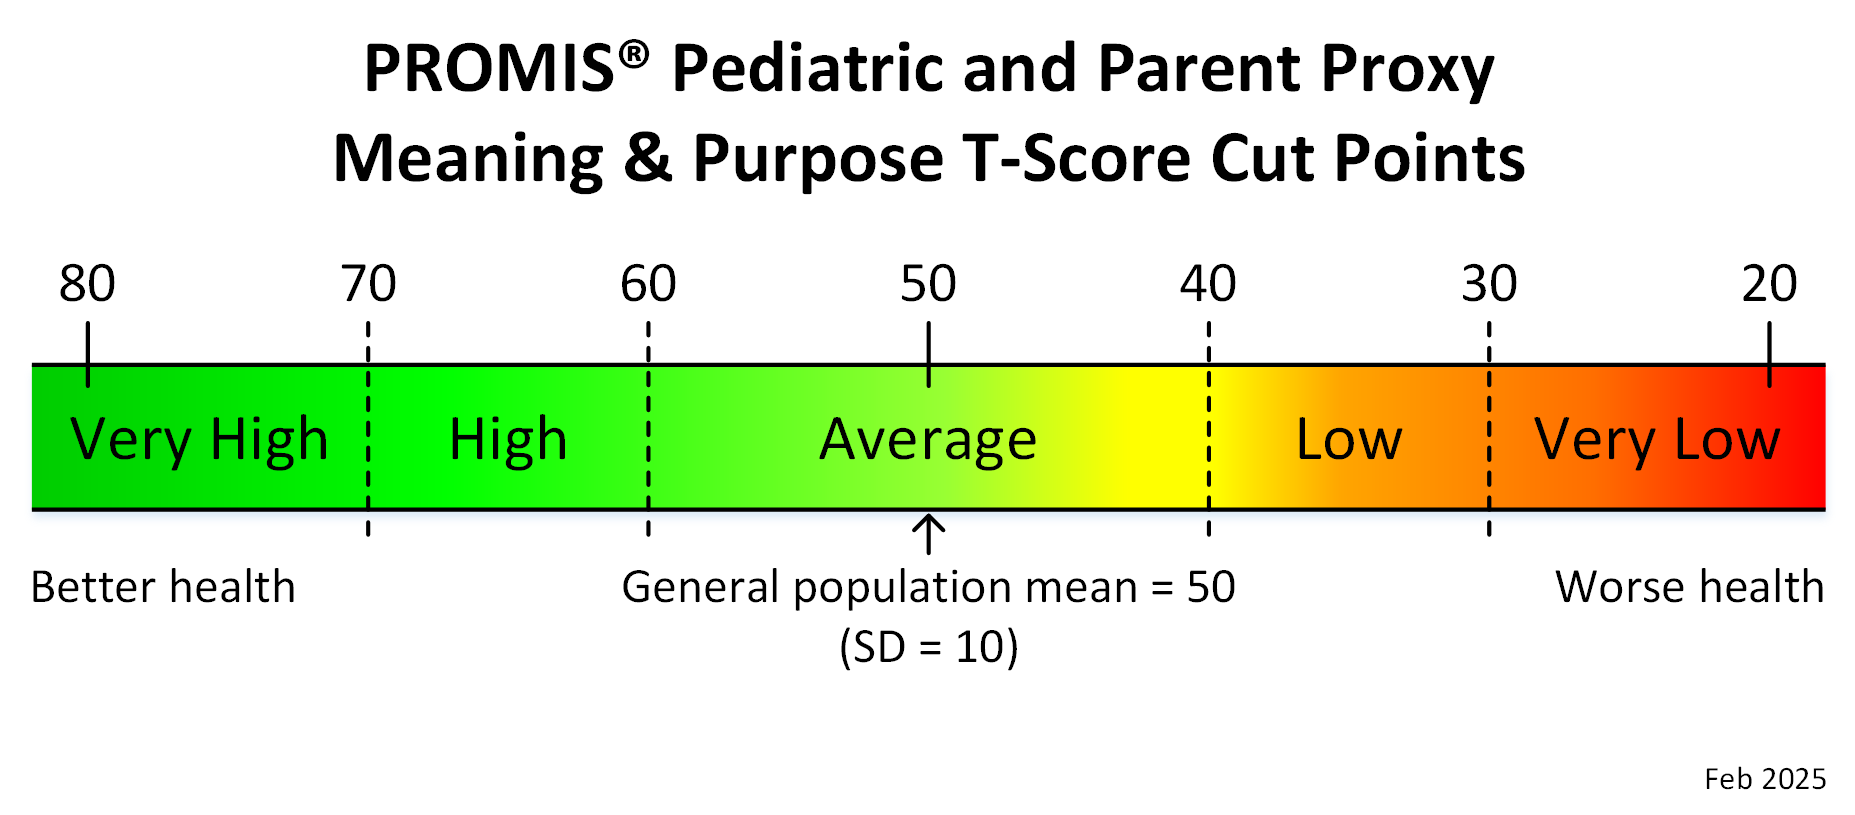
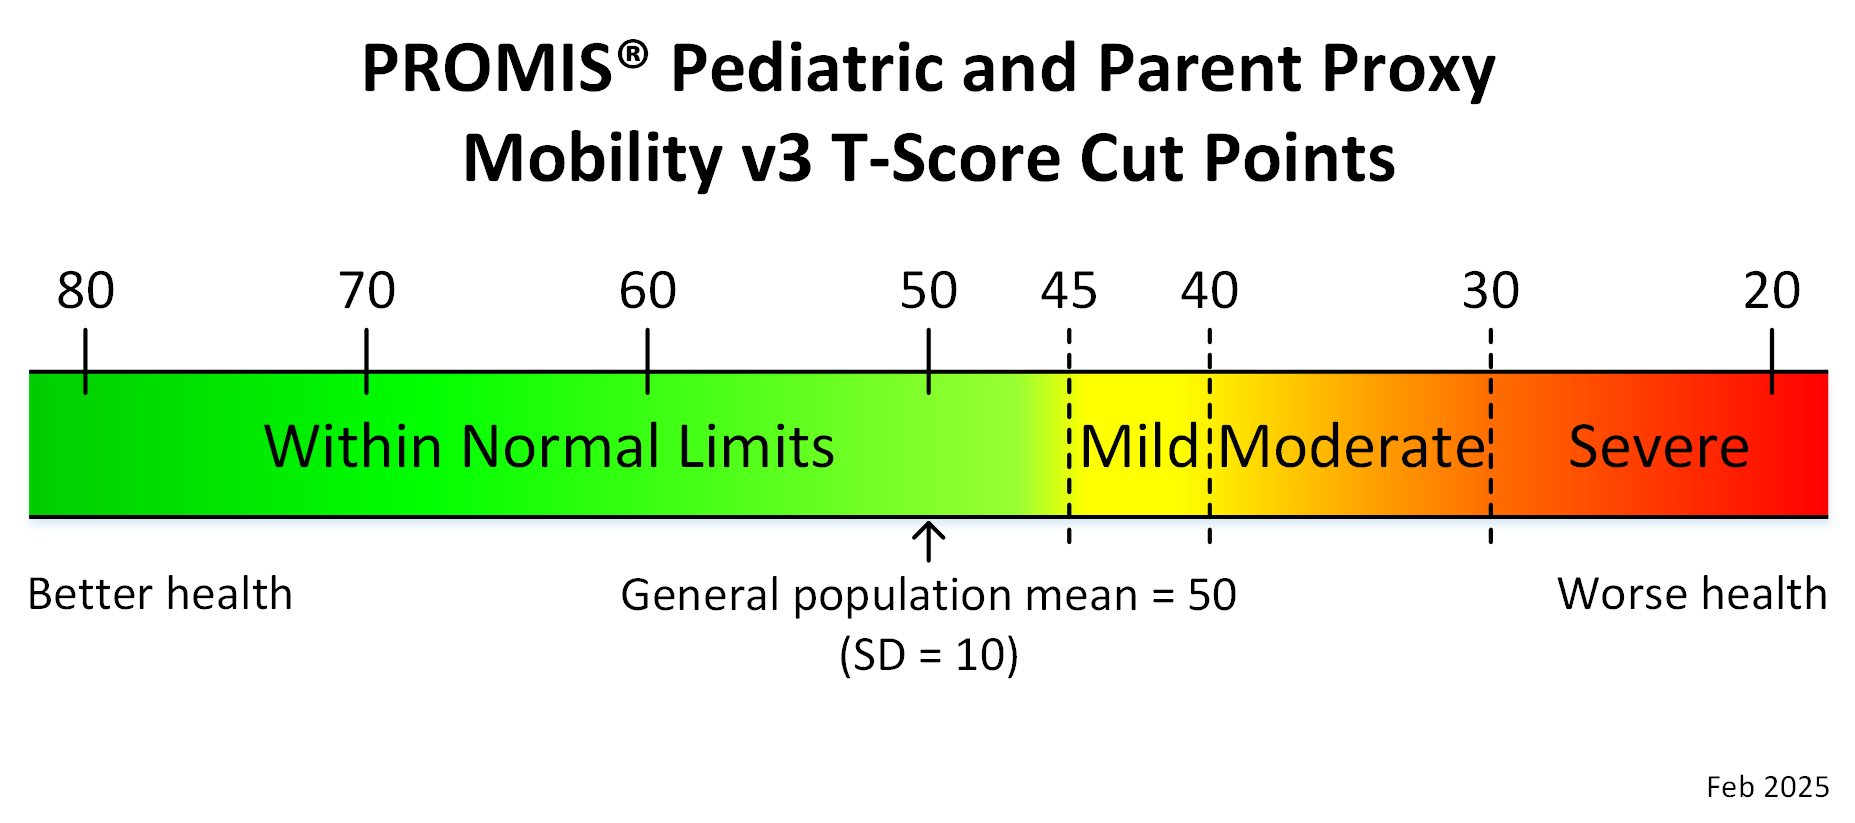
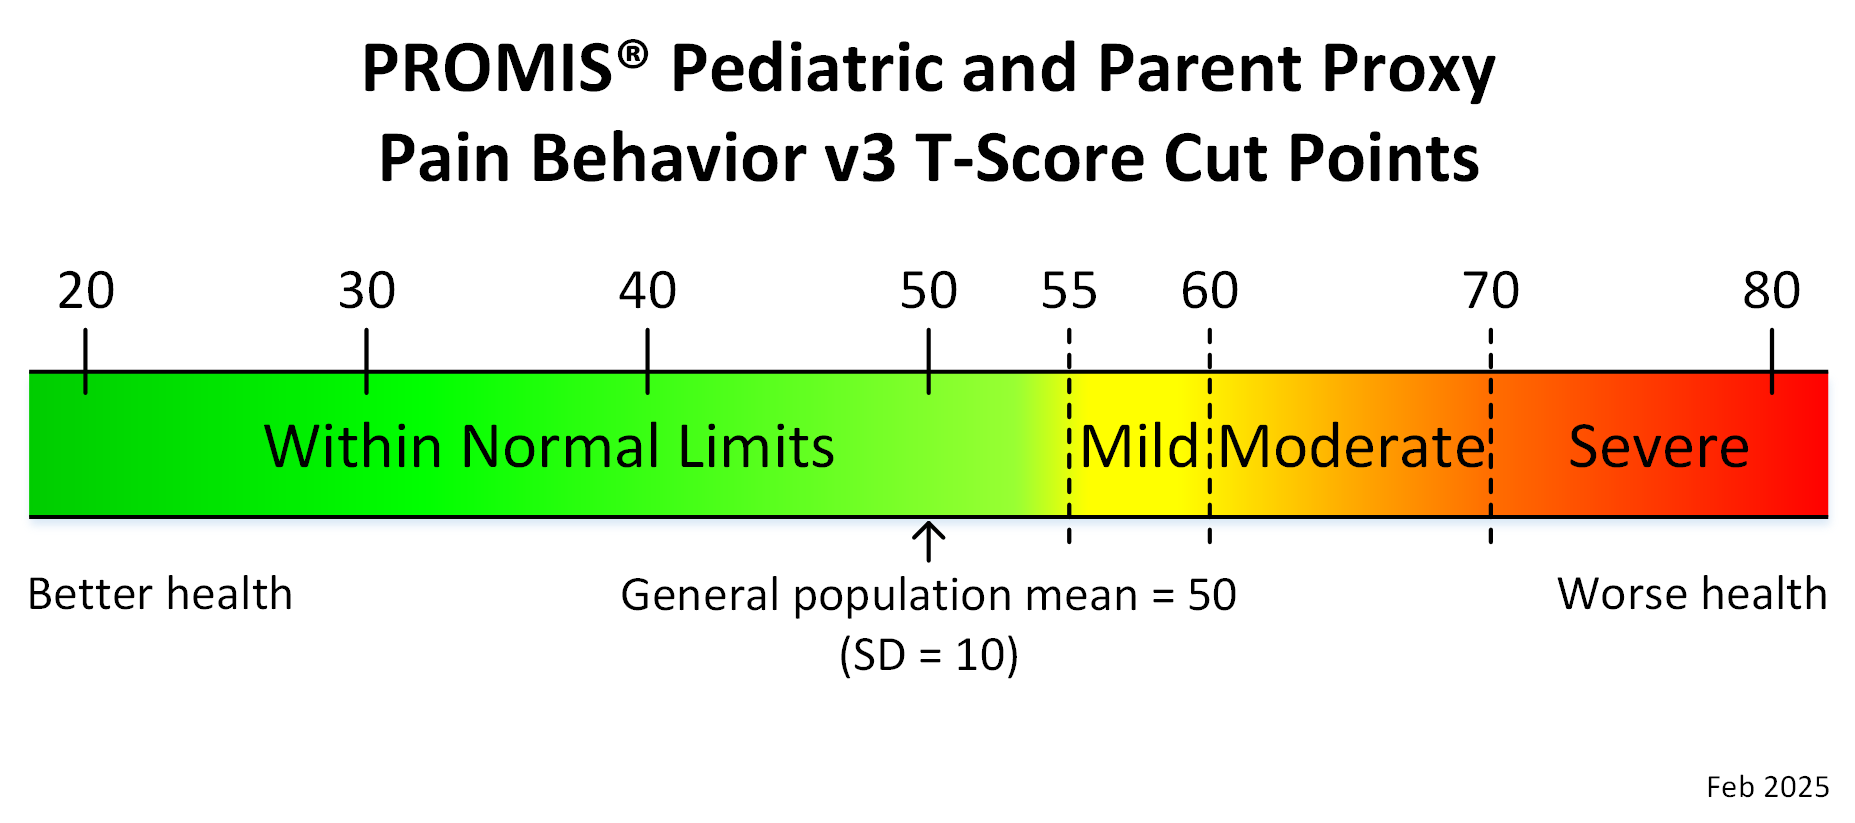
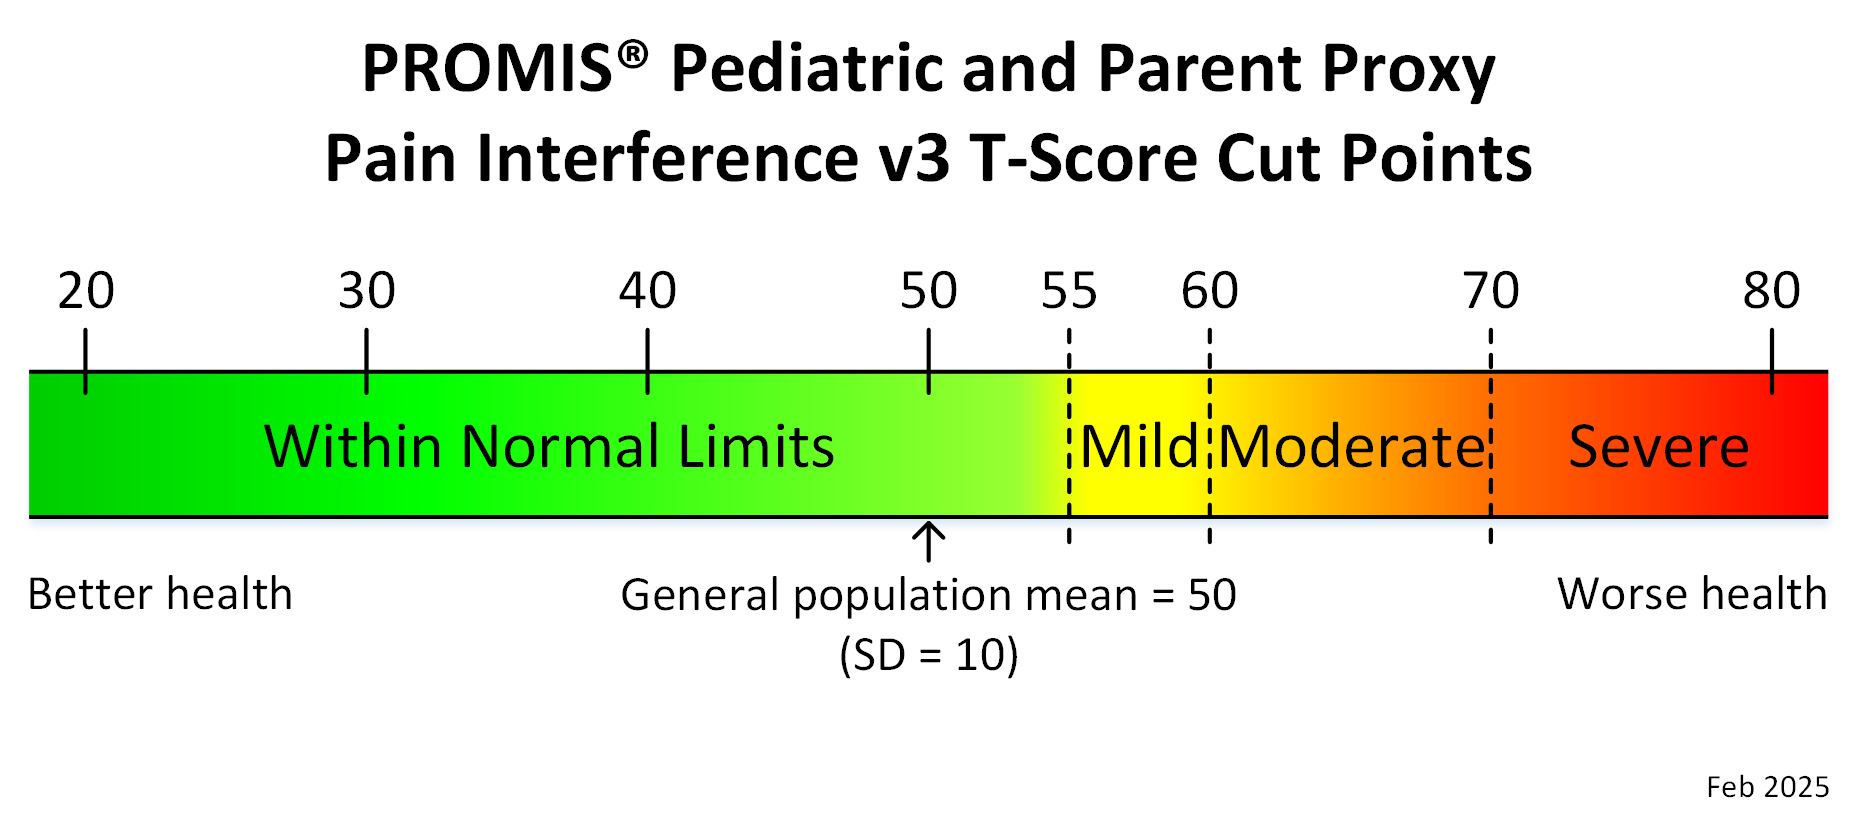
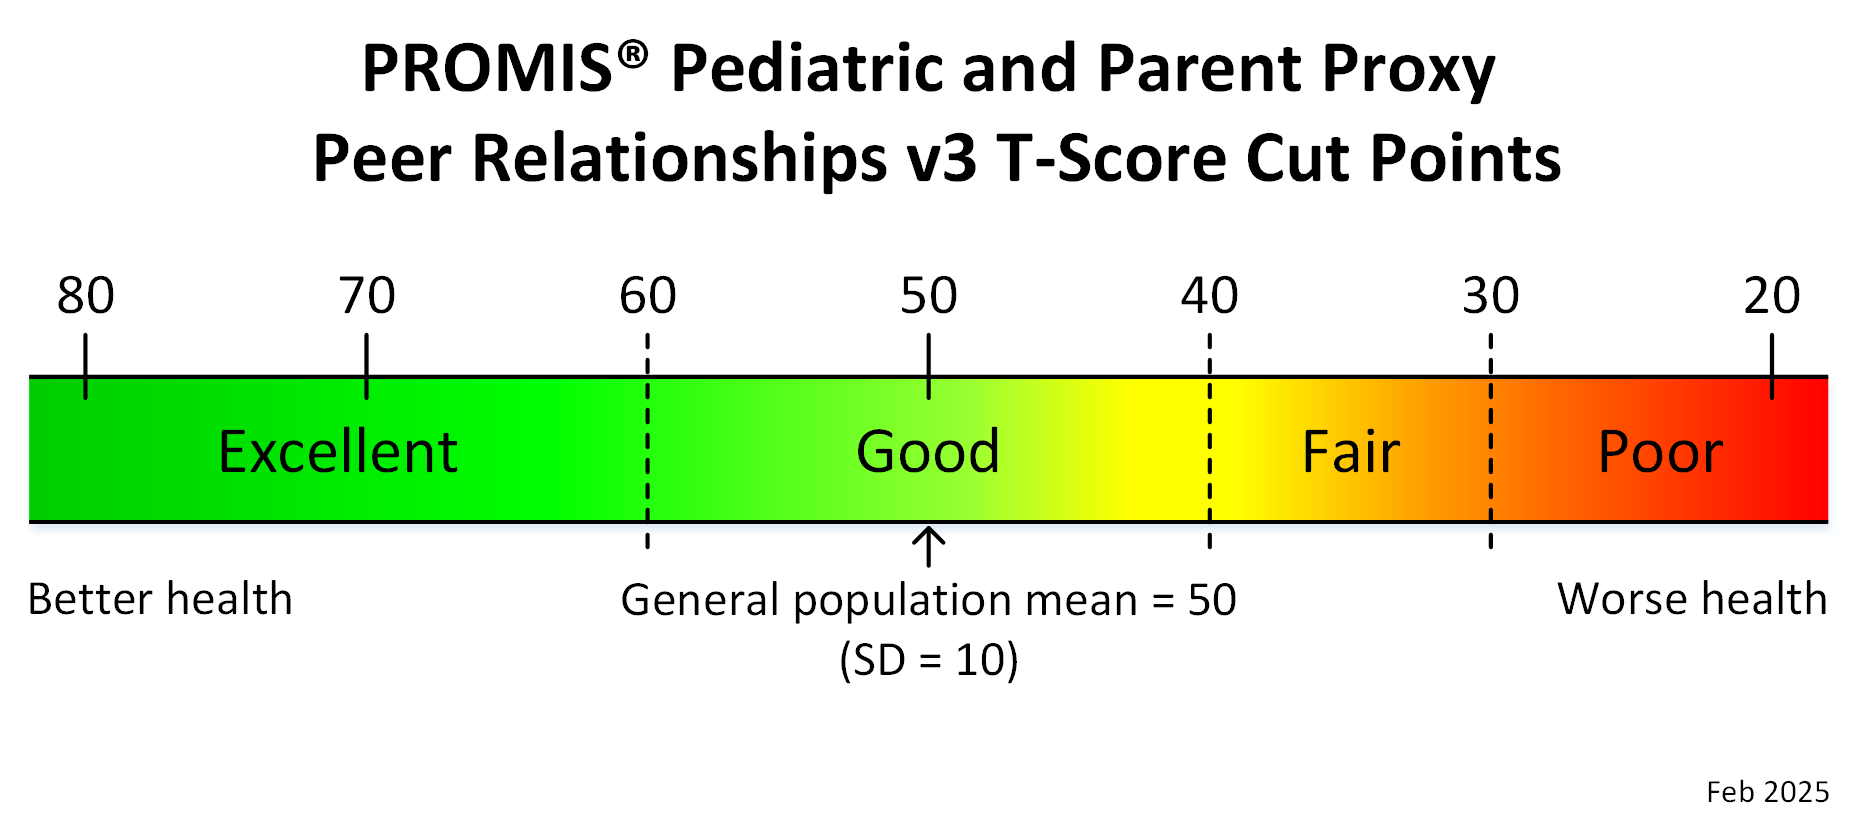
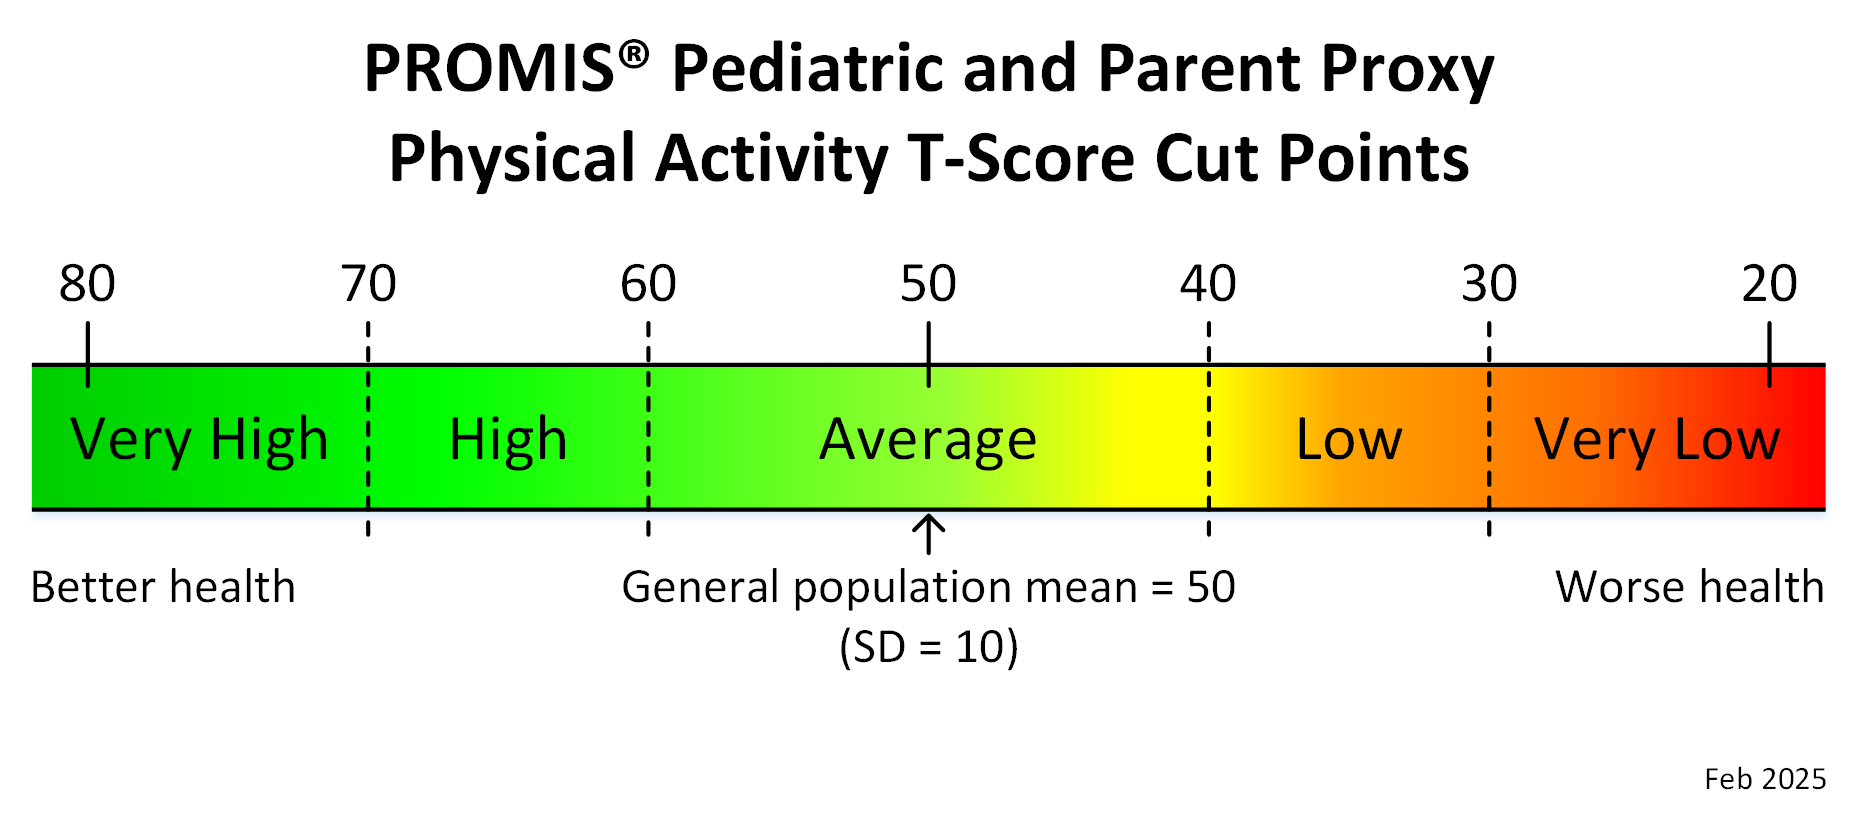
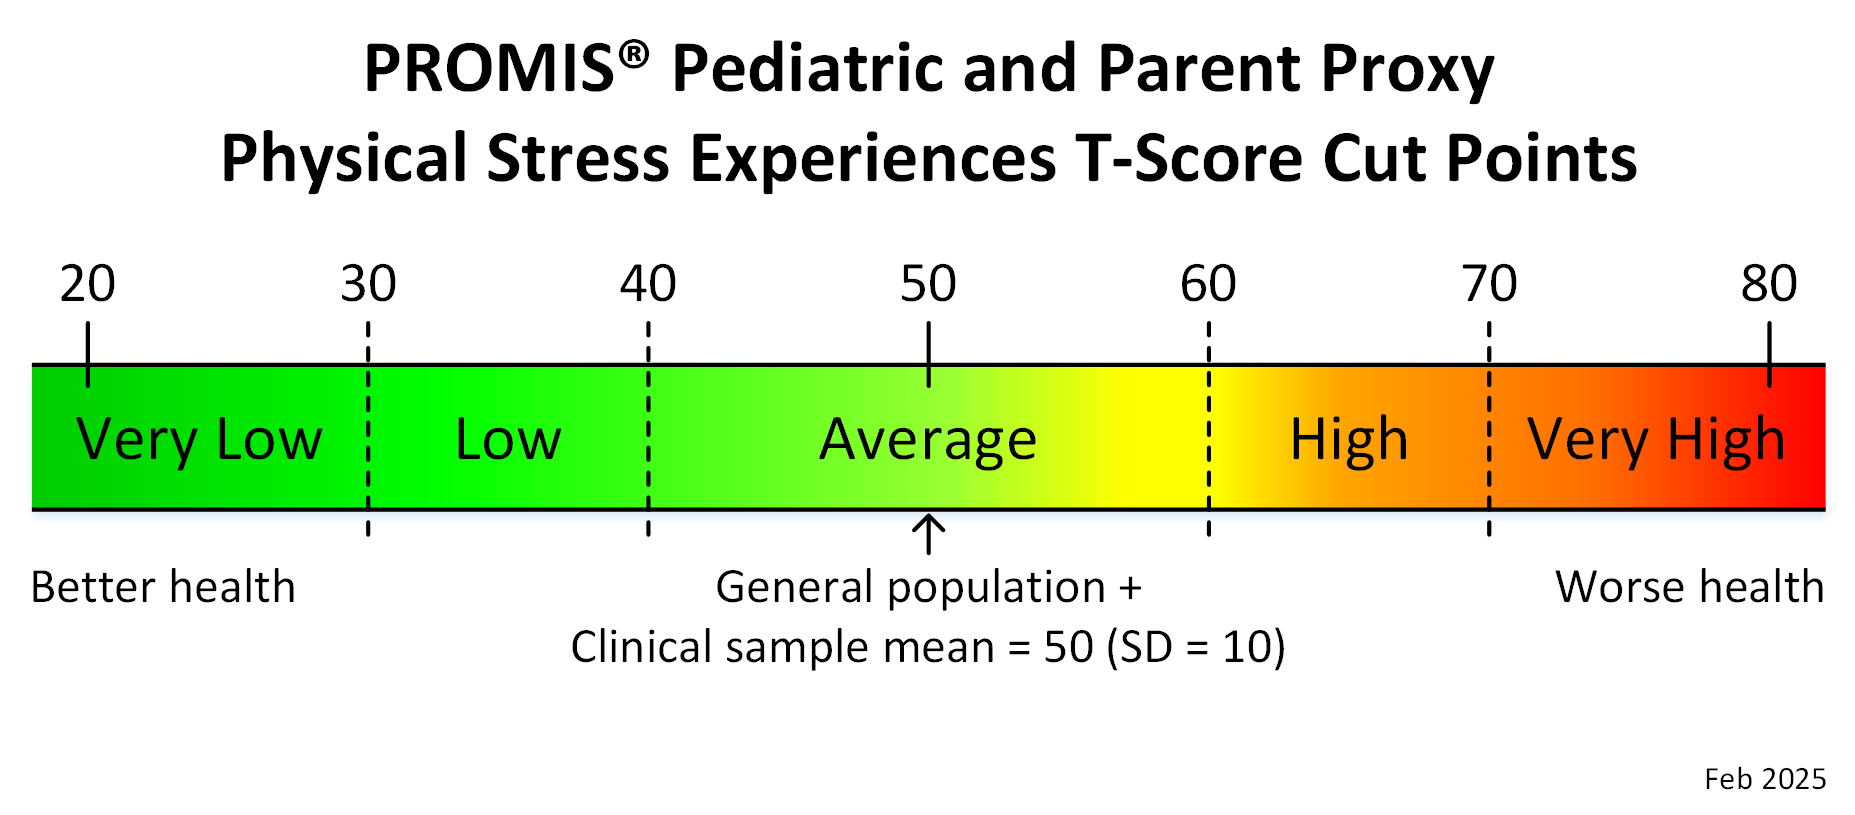
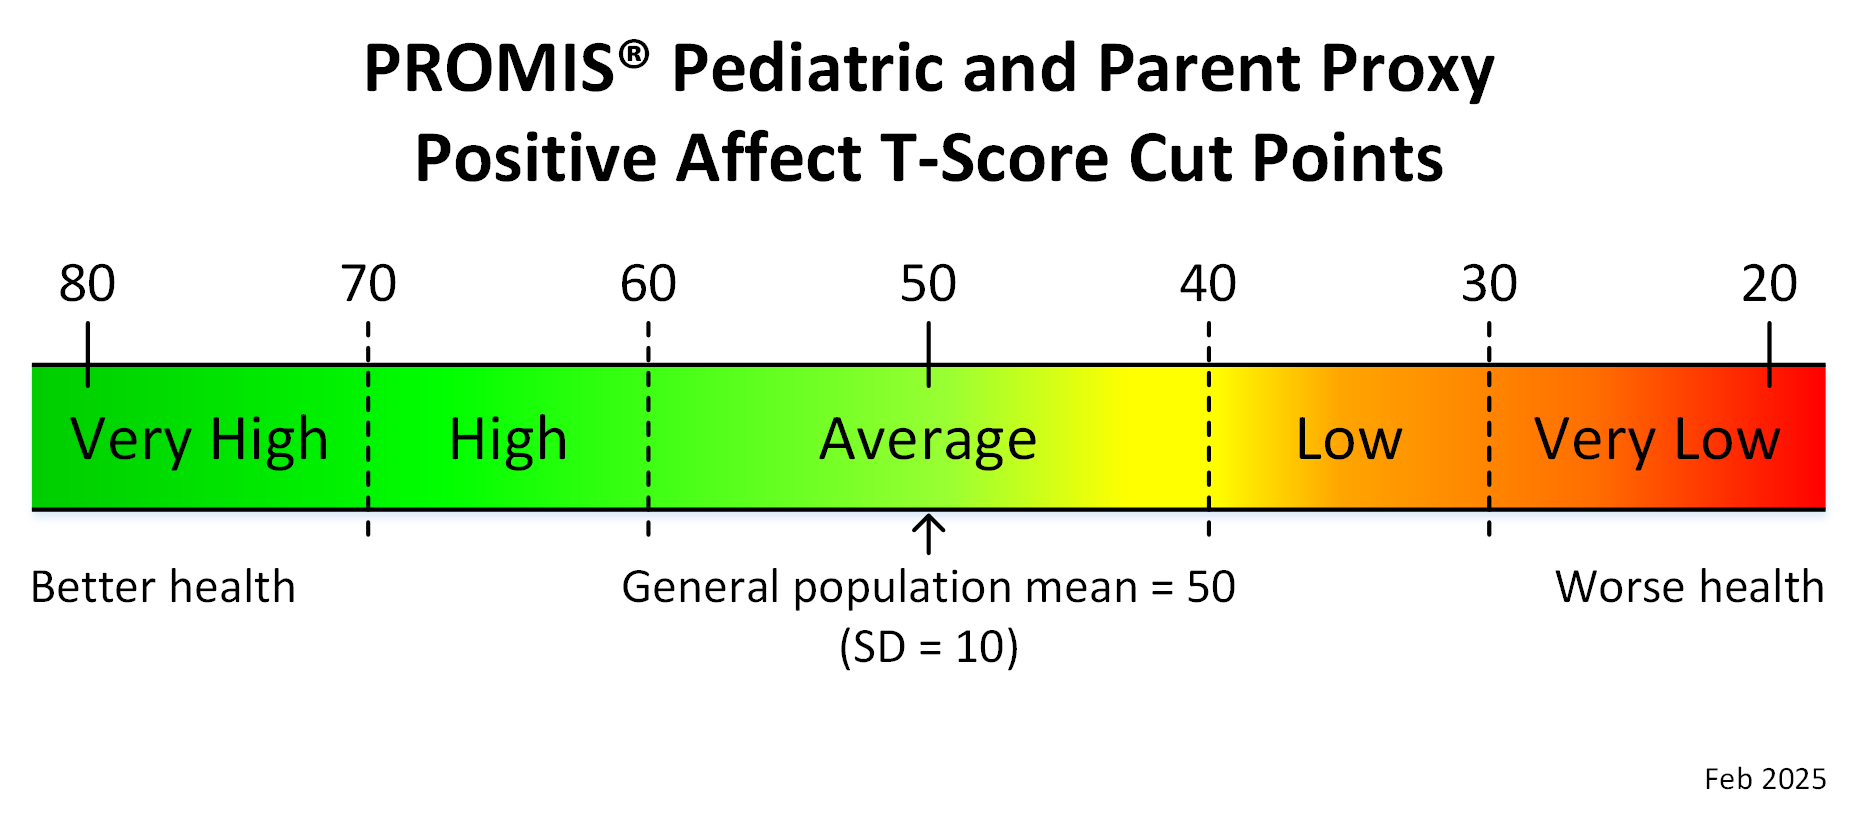
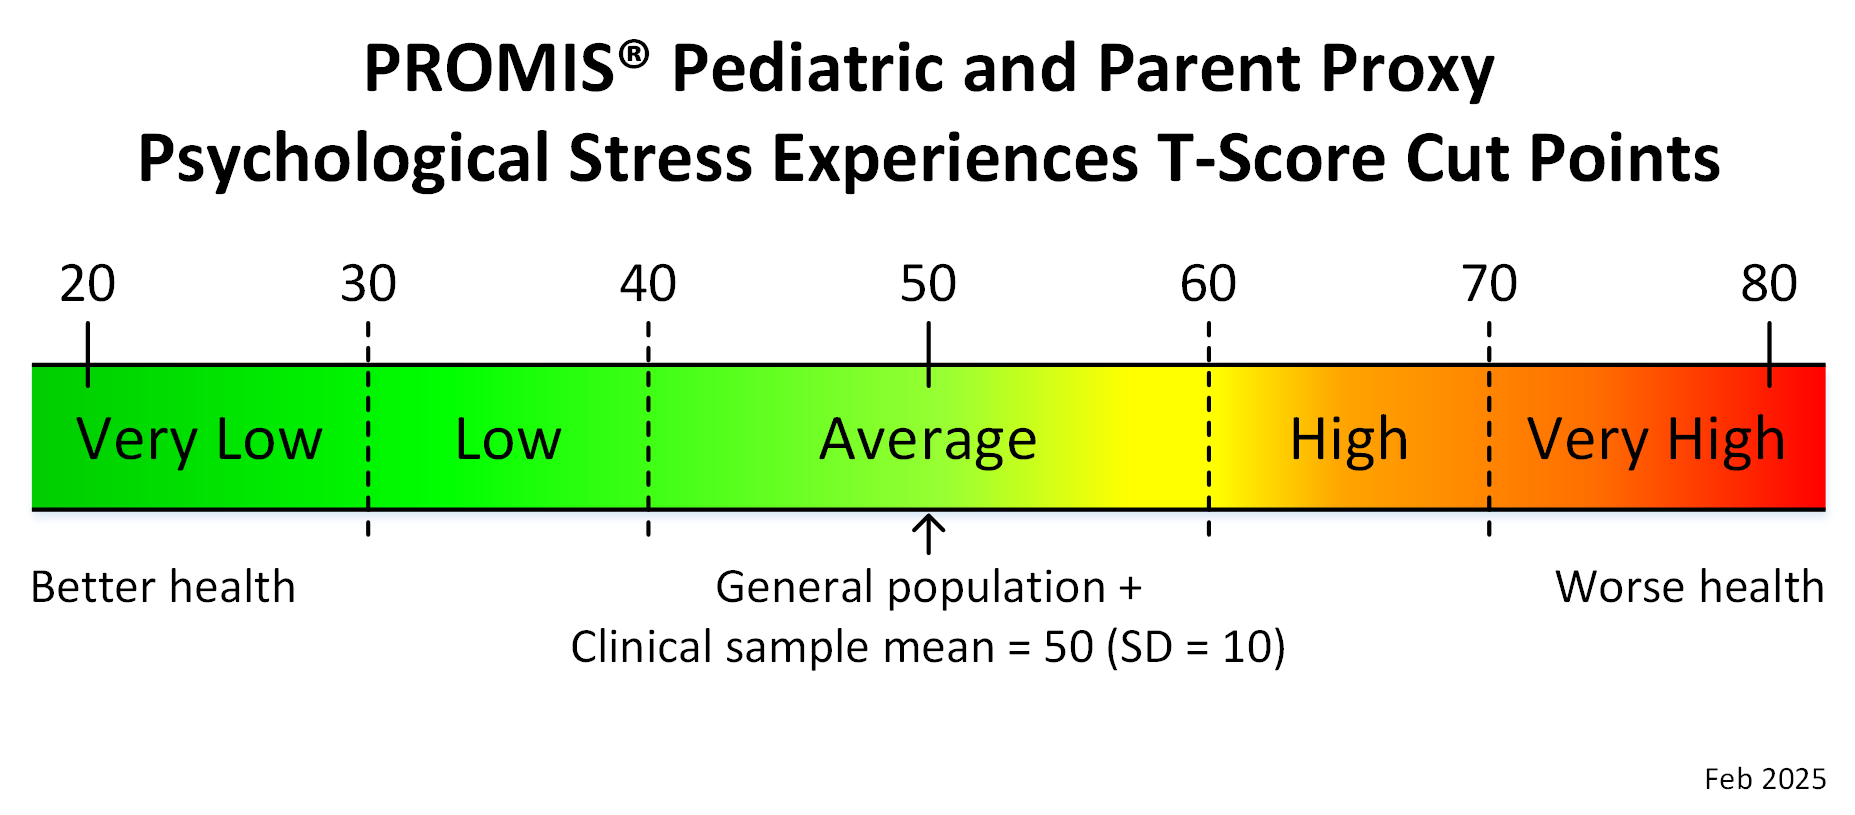
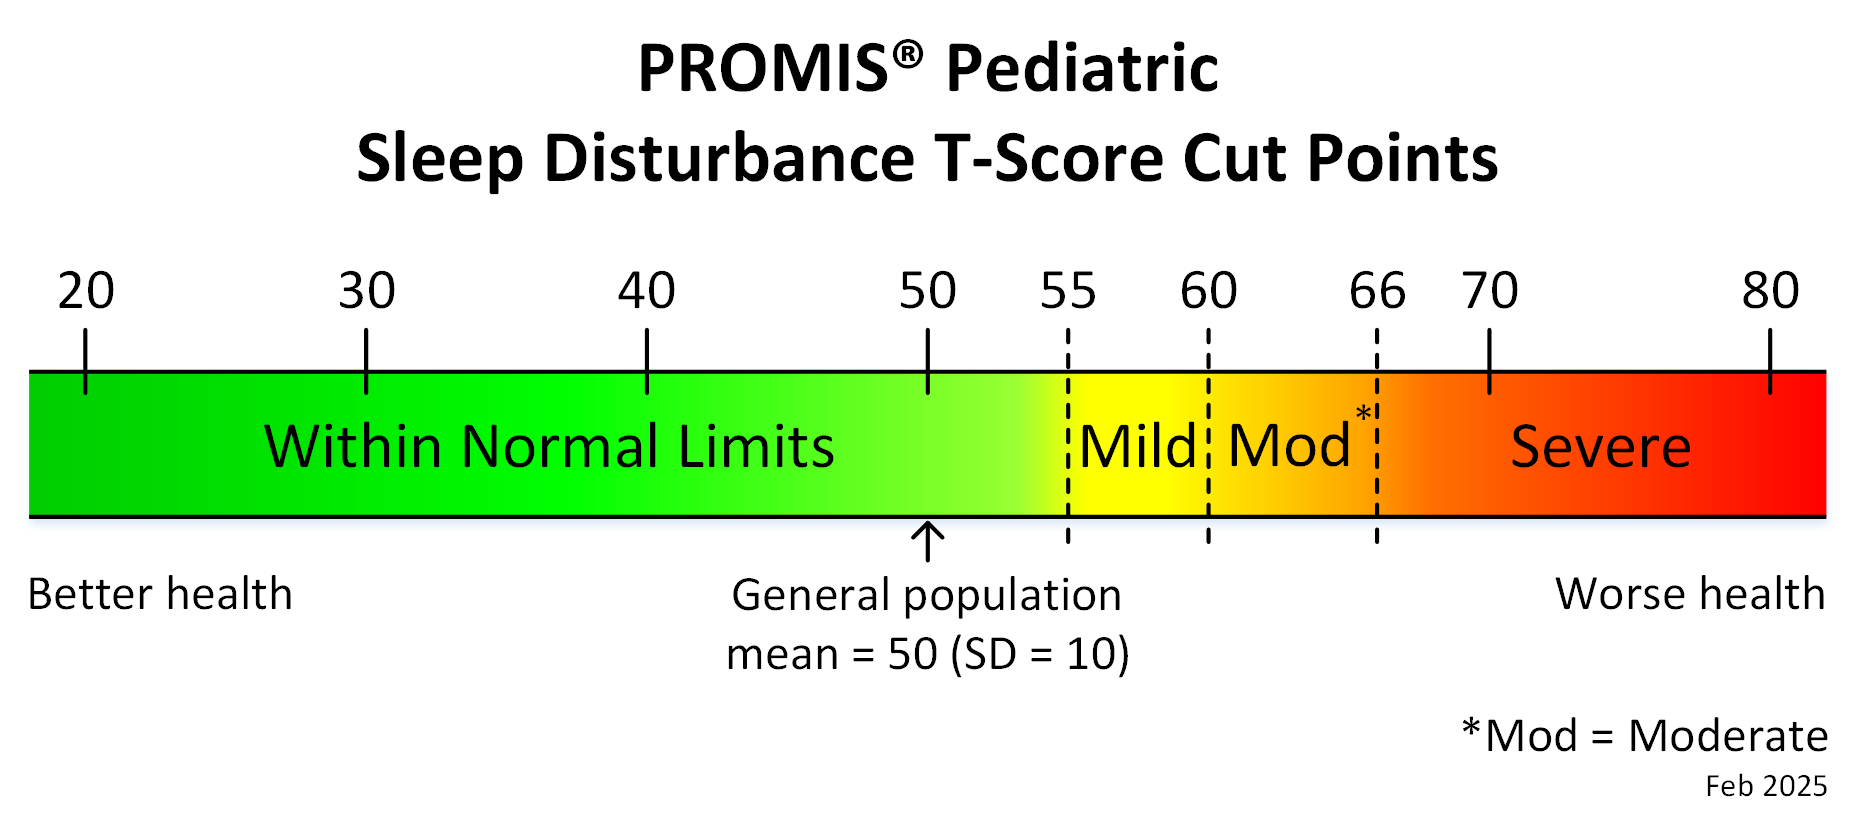
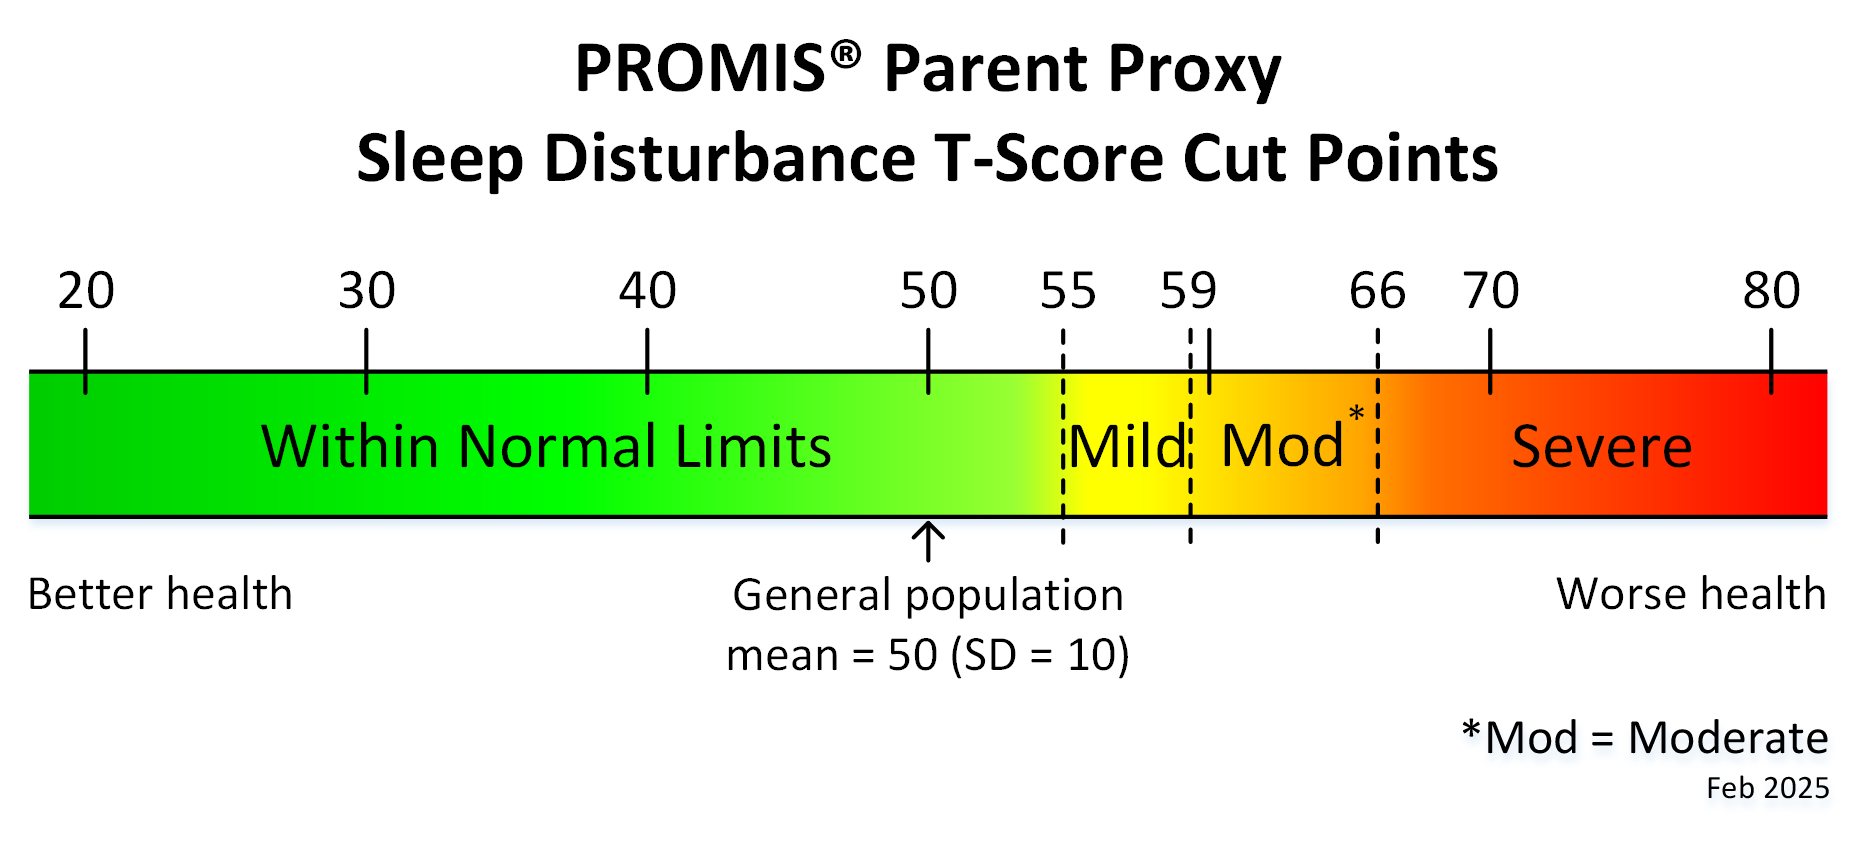
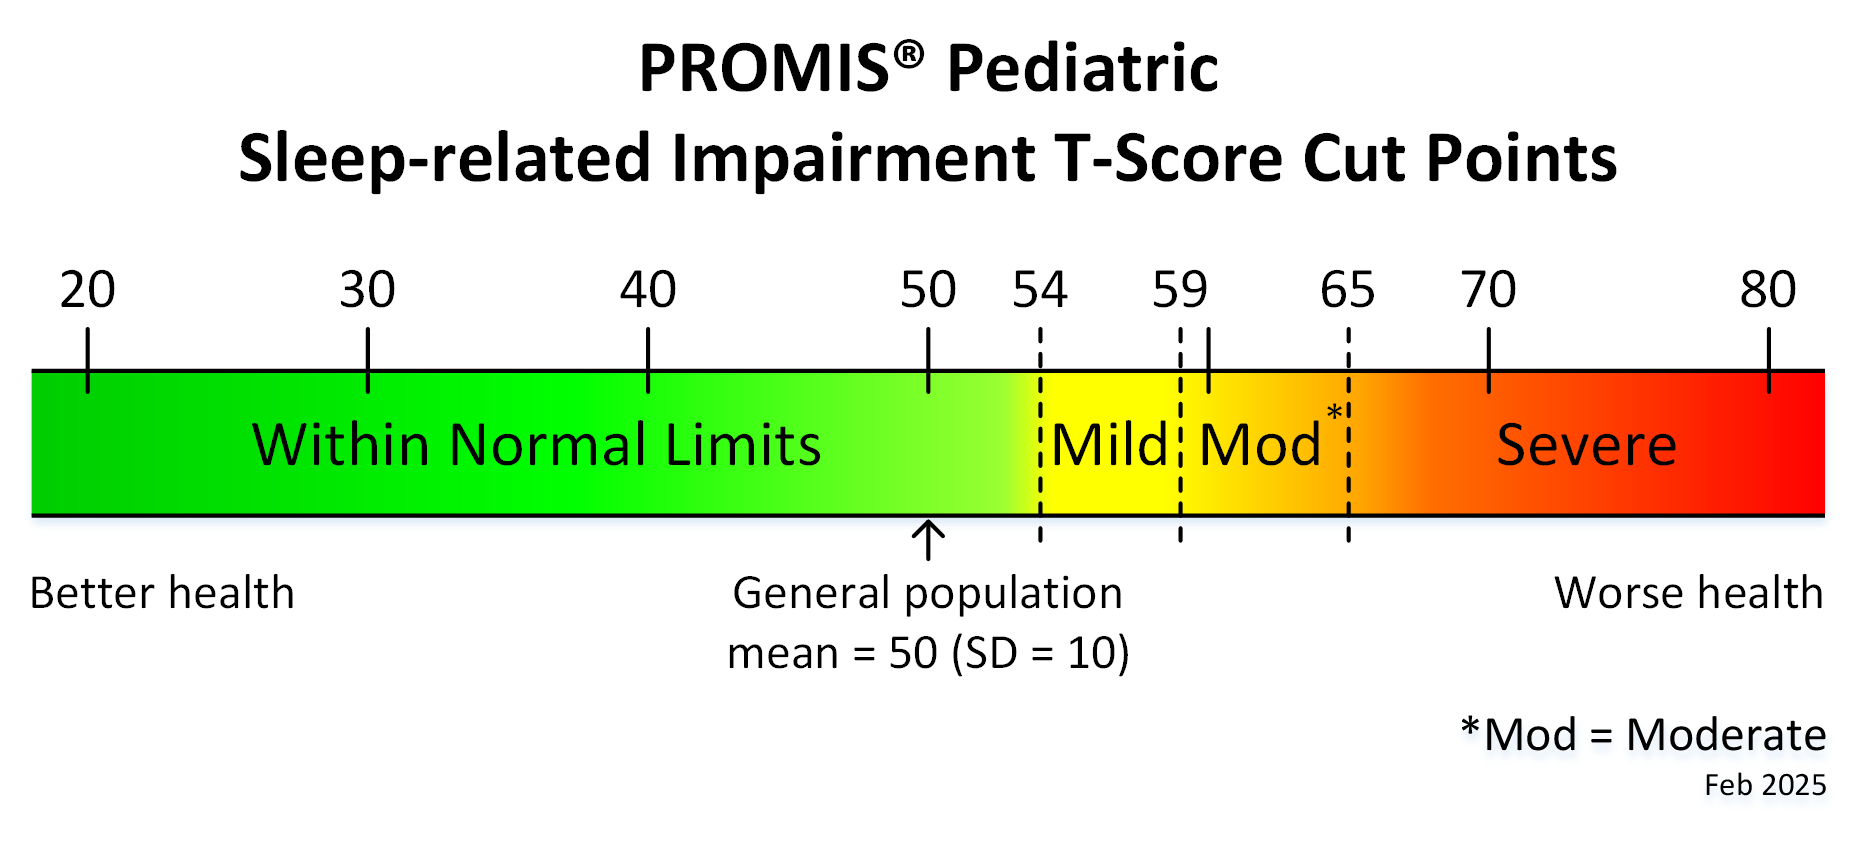
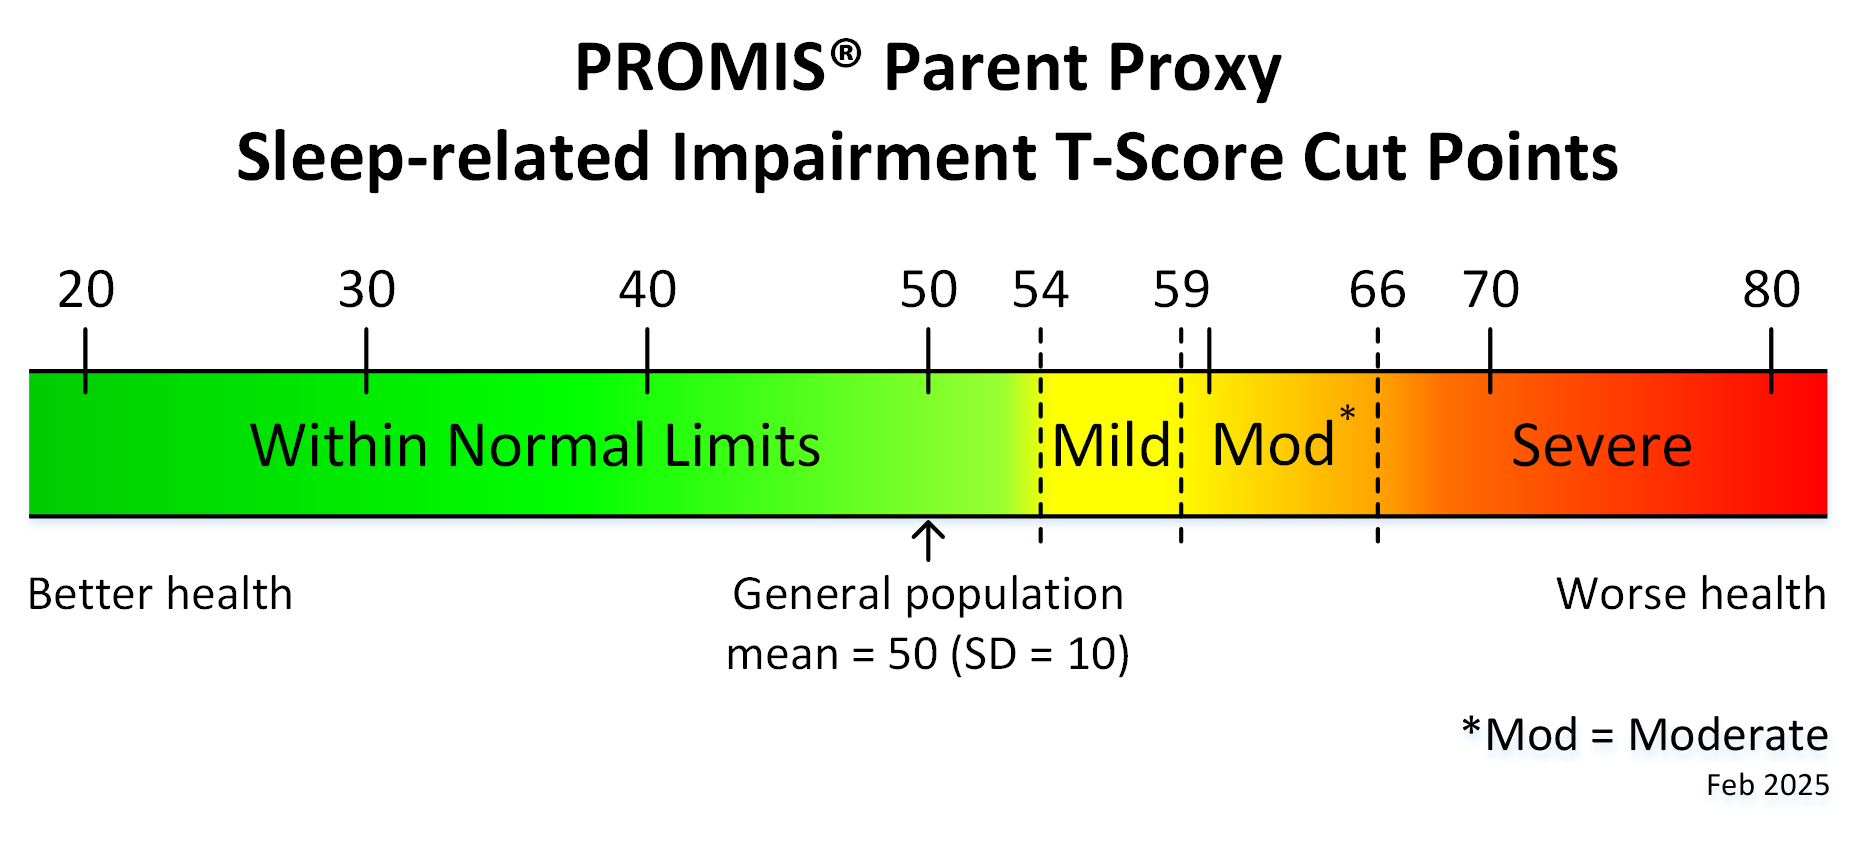
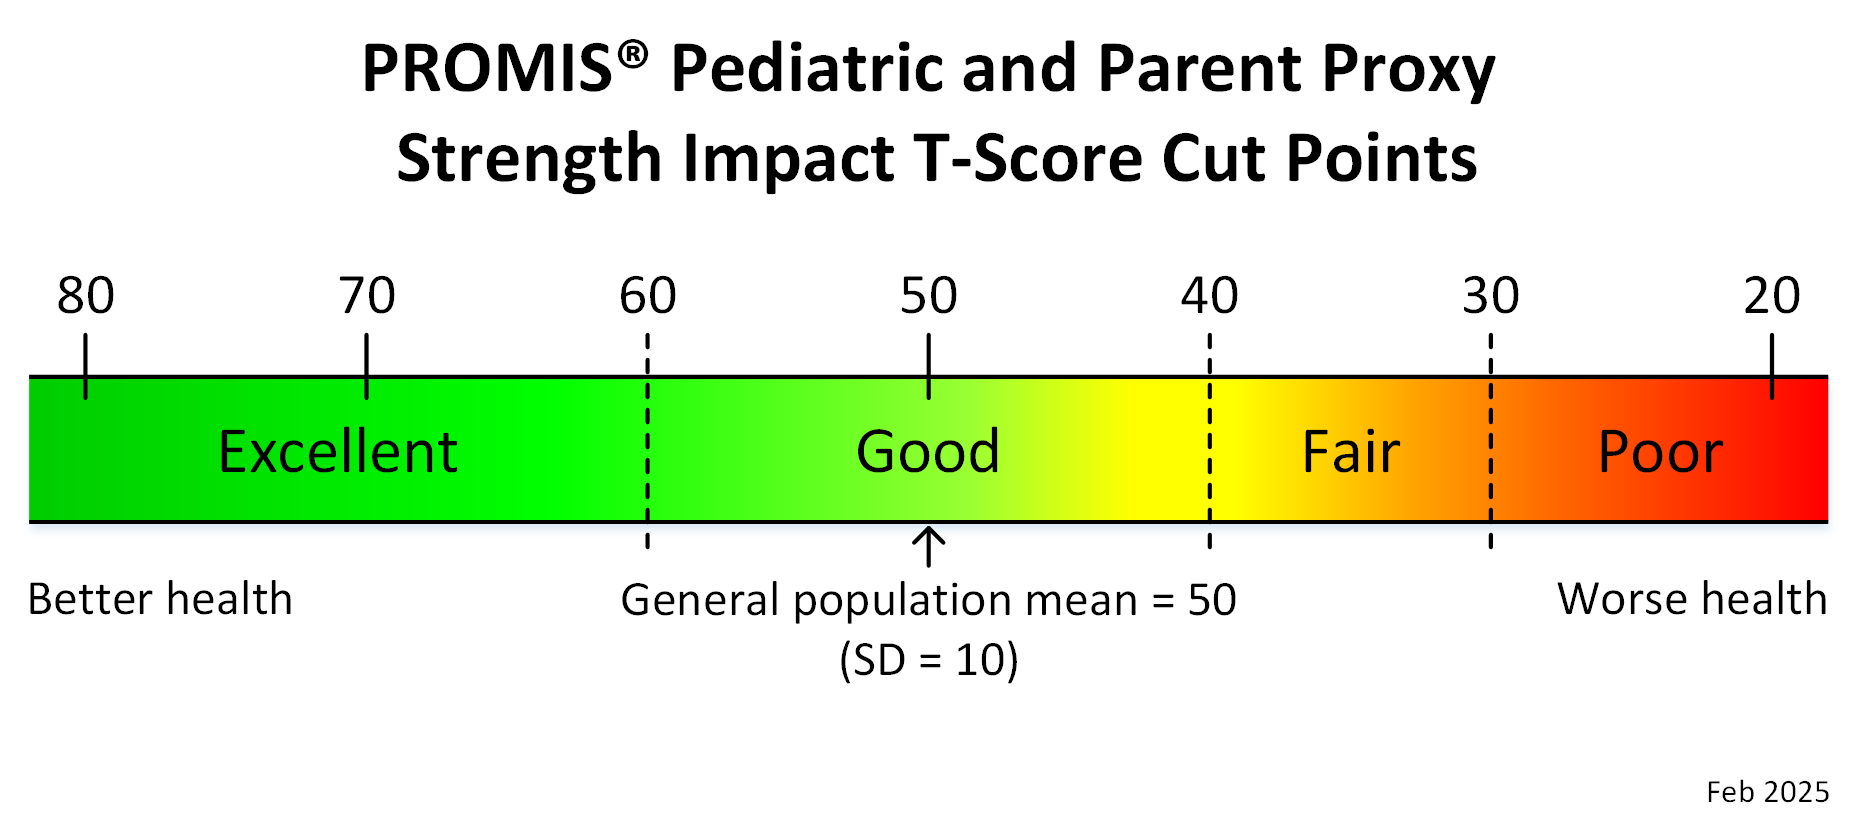
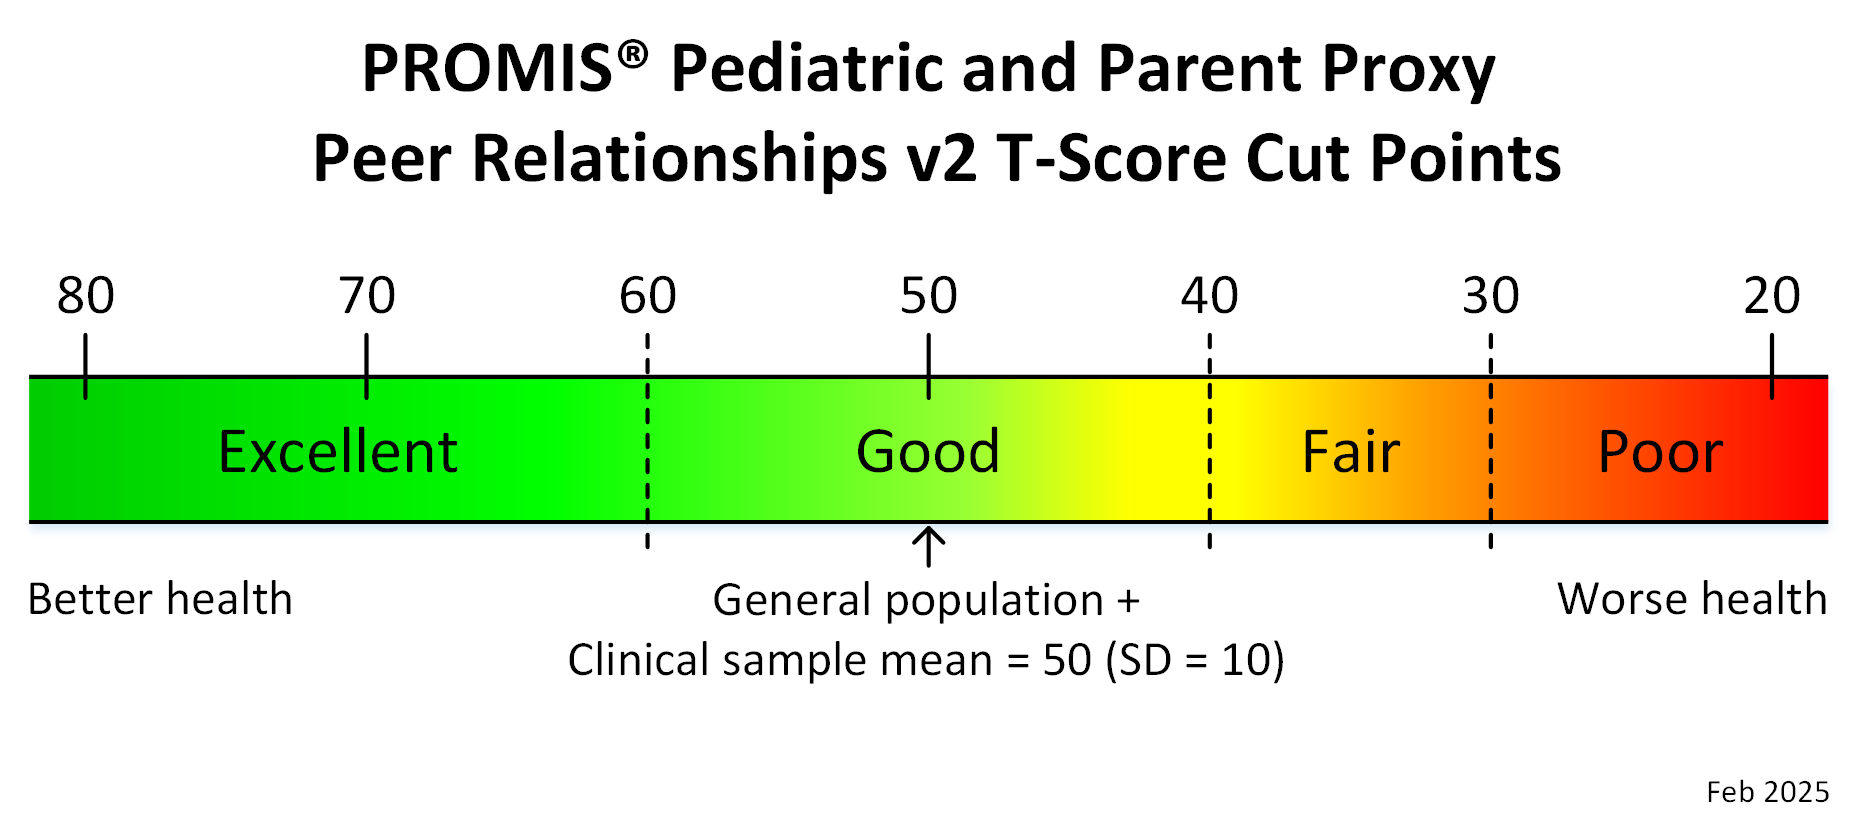
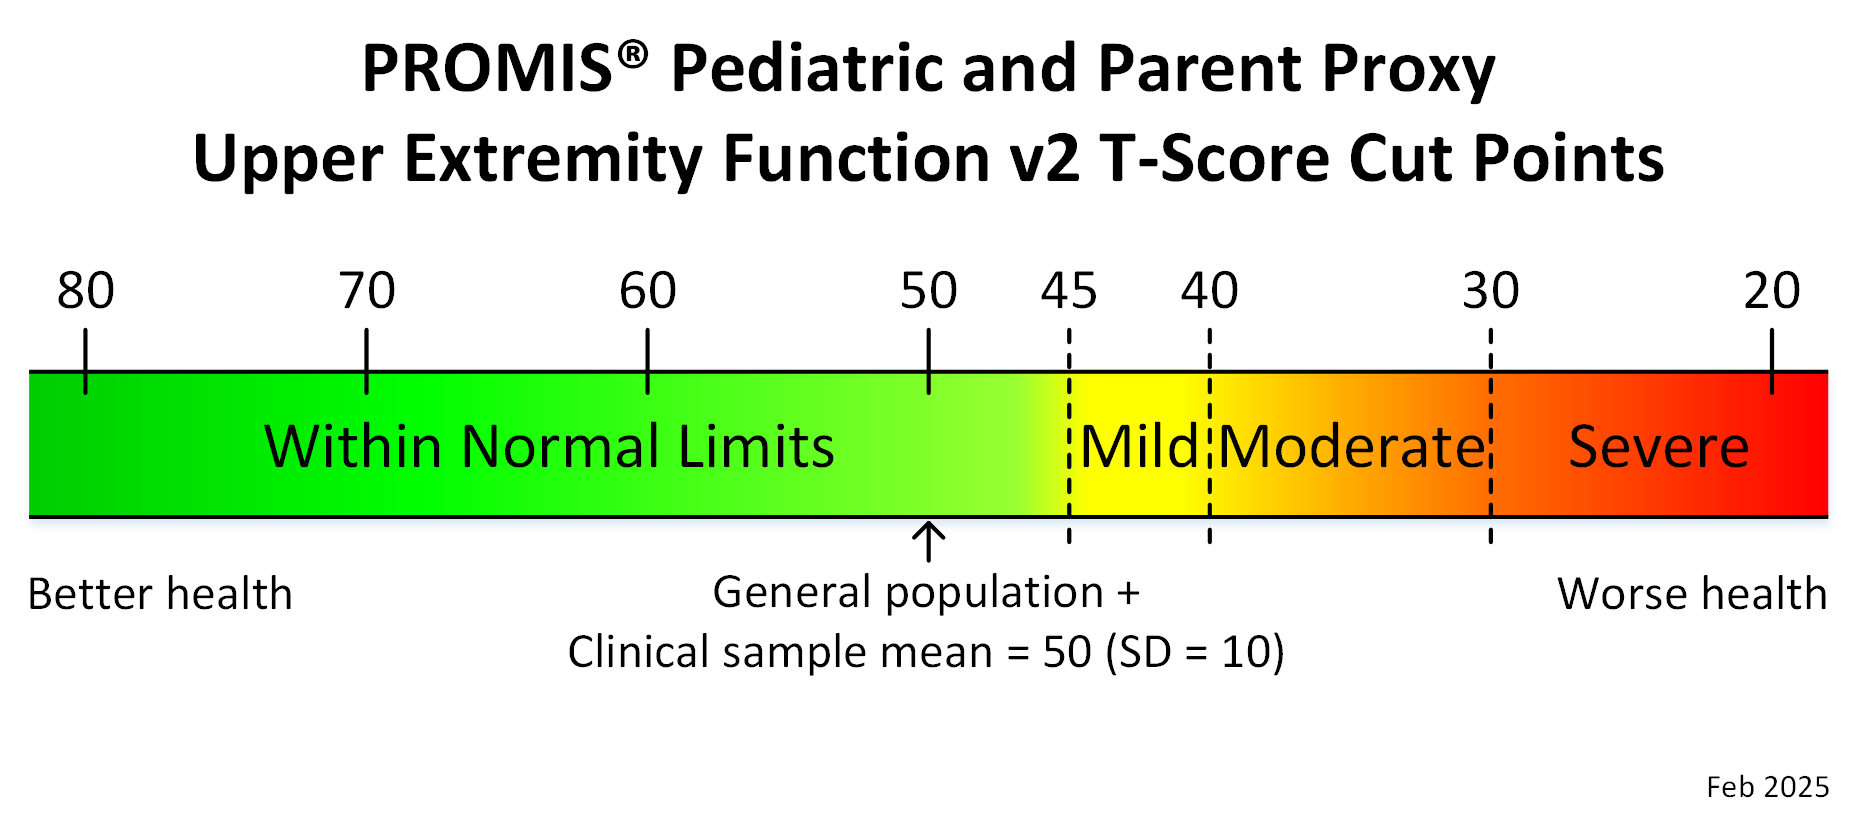
Most PROMIS Pediatric and Parent Proxy measures use the same score cut points.


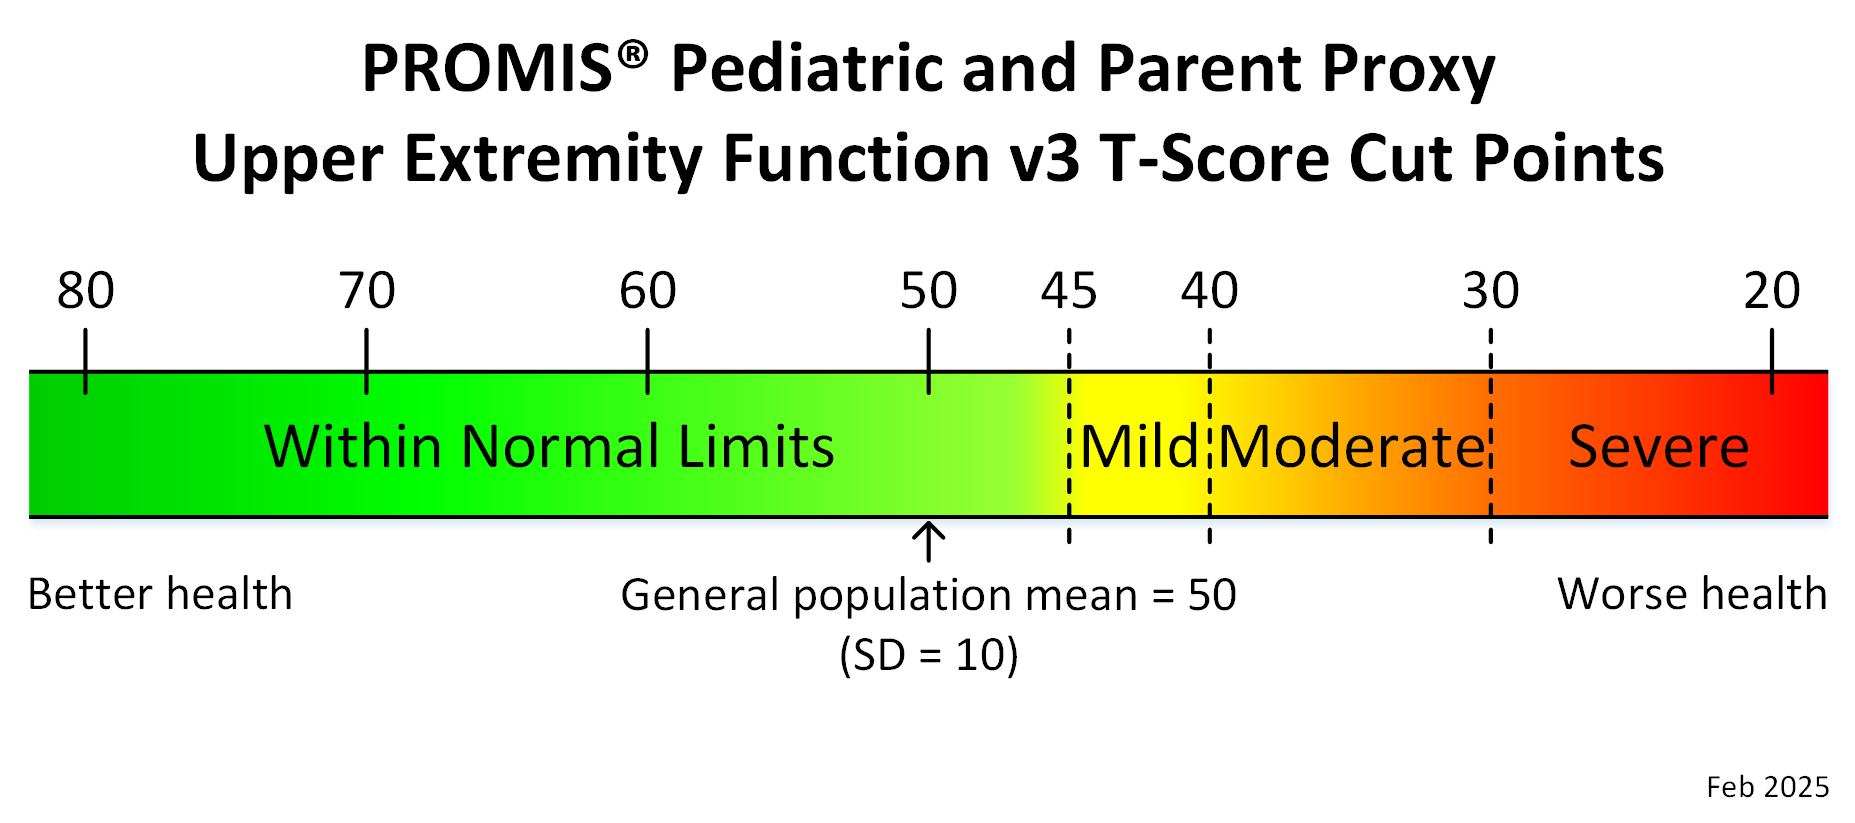
Retired PROMIS Pediatric & Parent Proxy Measures
Most PROMIS Pediatric and Parent Proxy measures use the same score cut points.
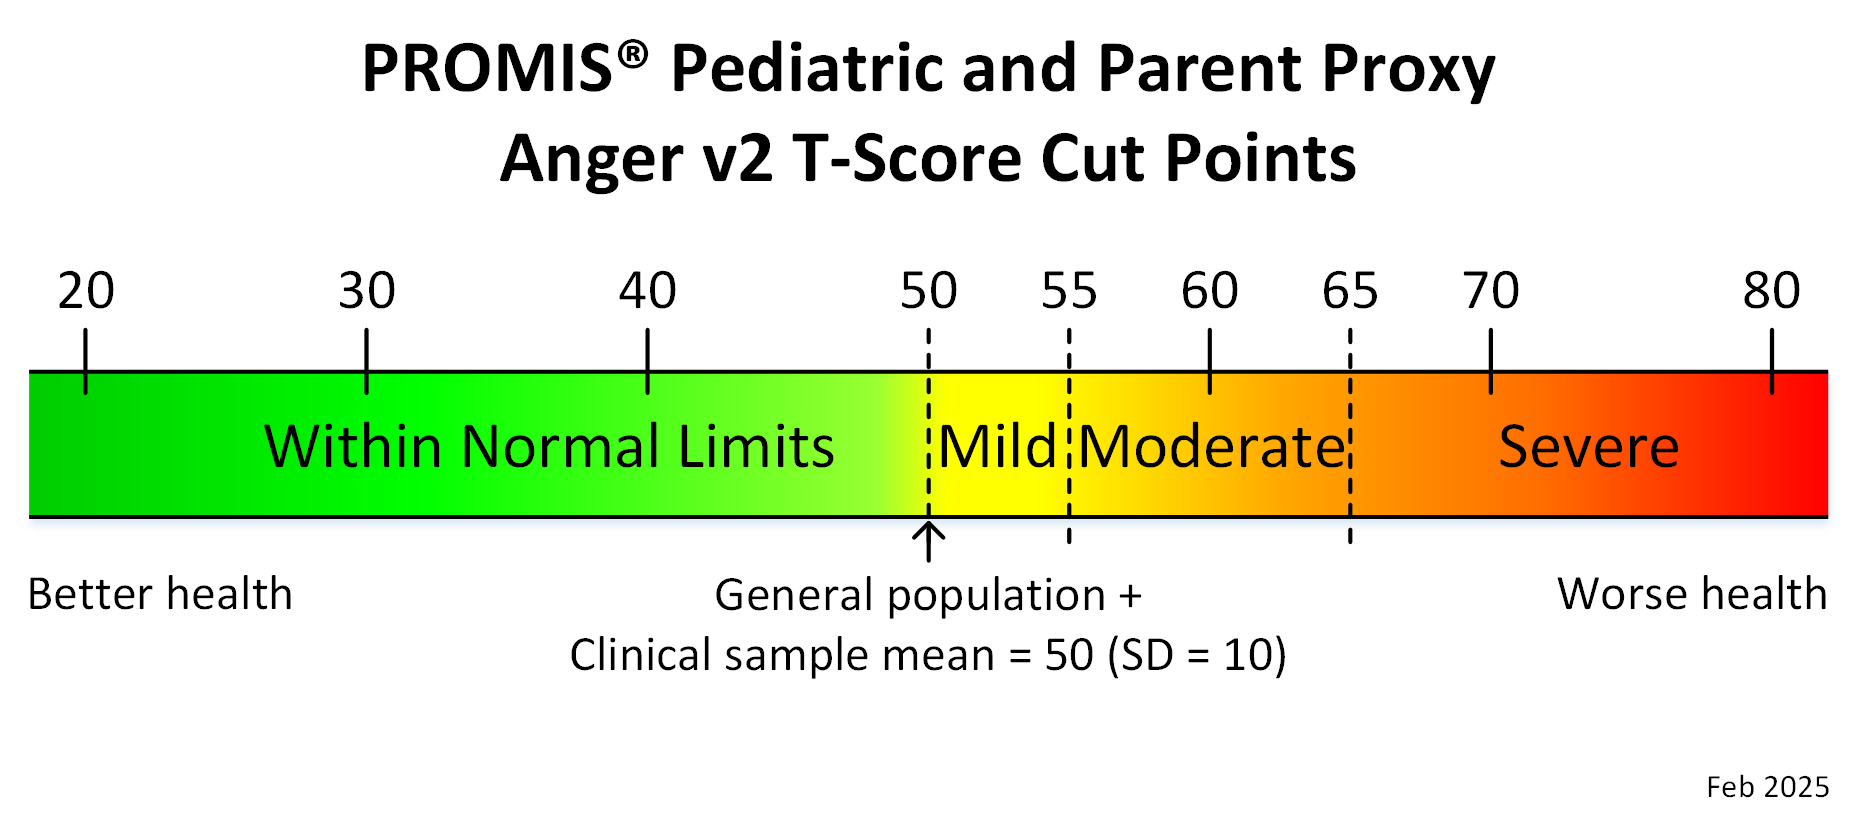
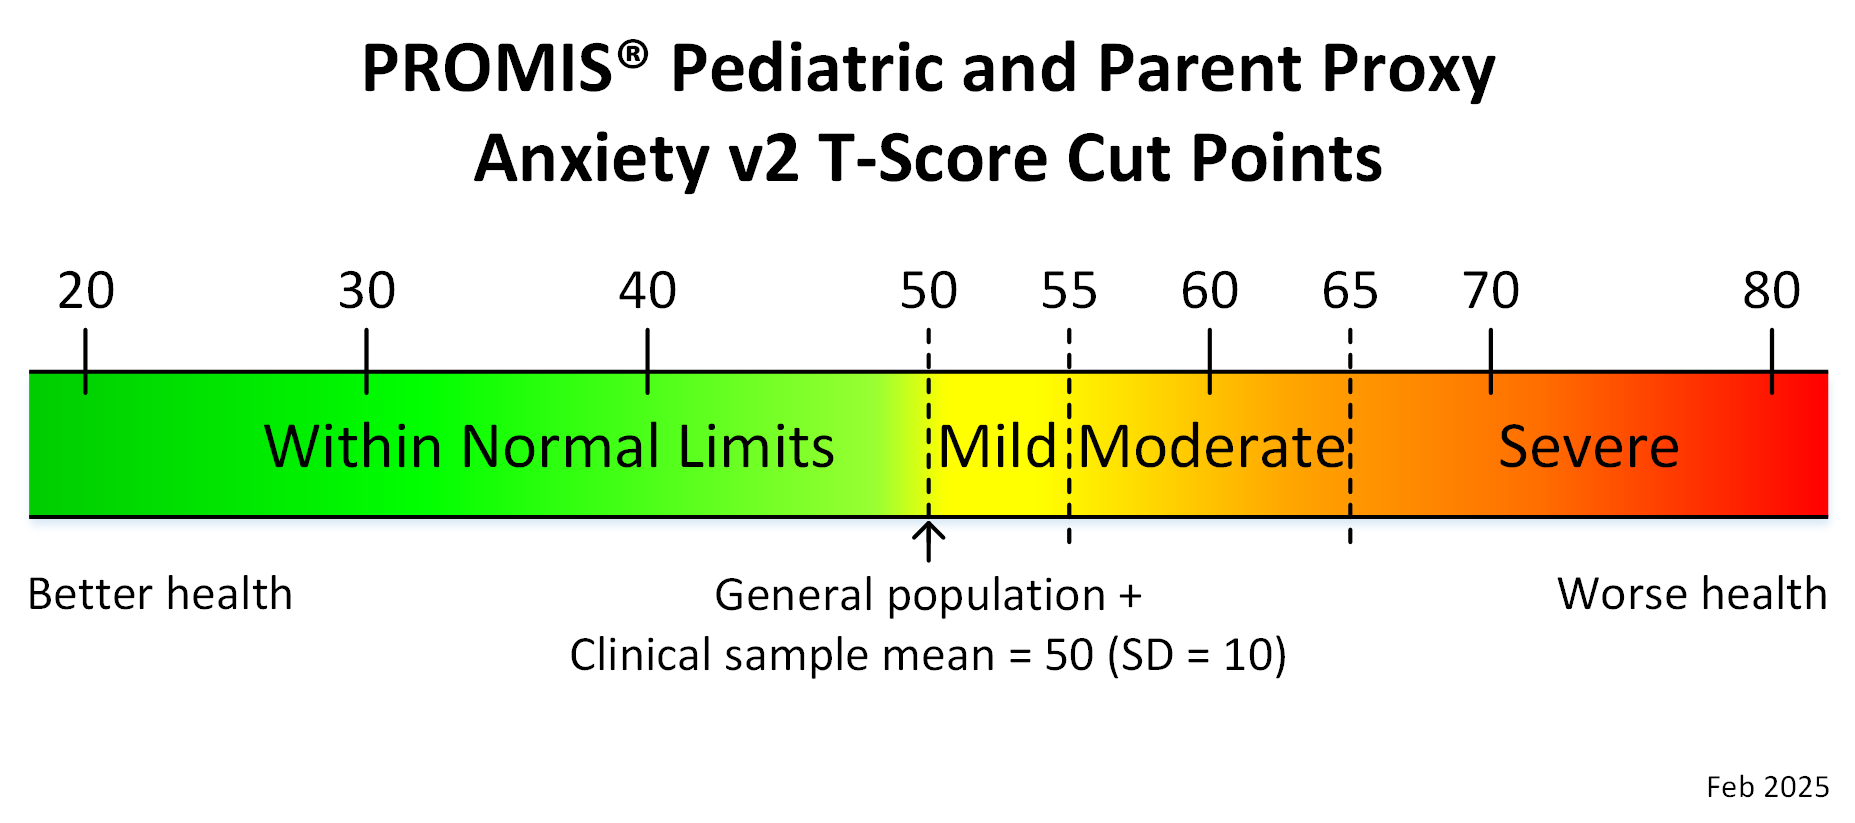
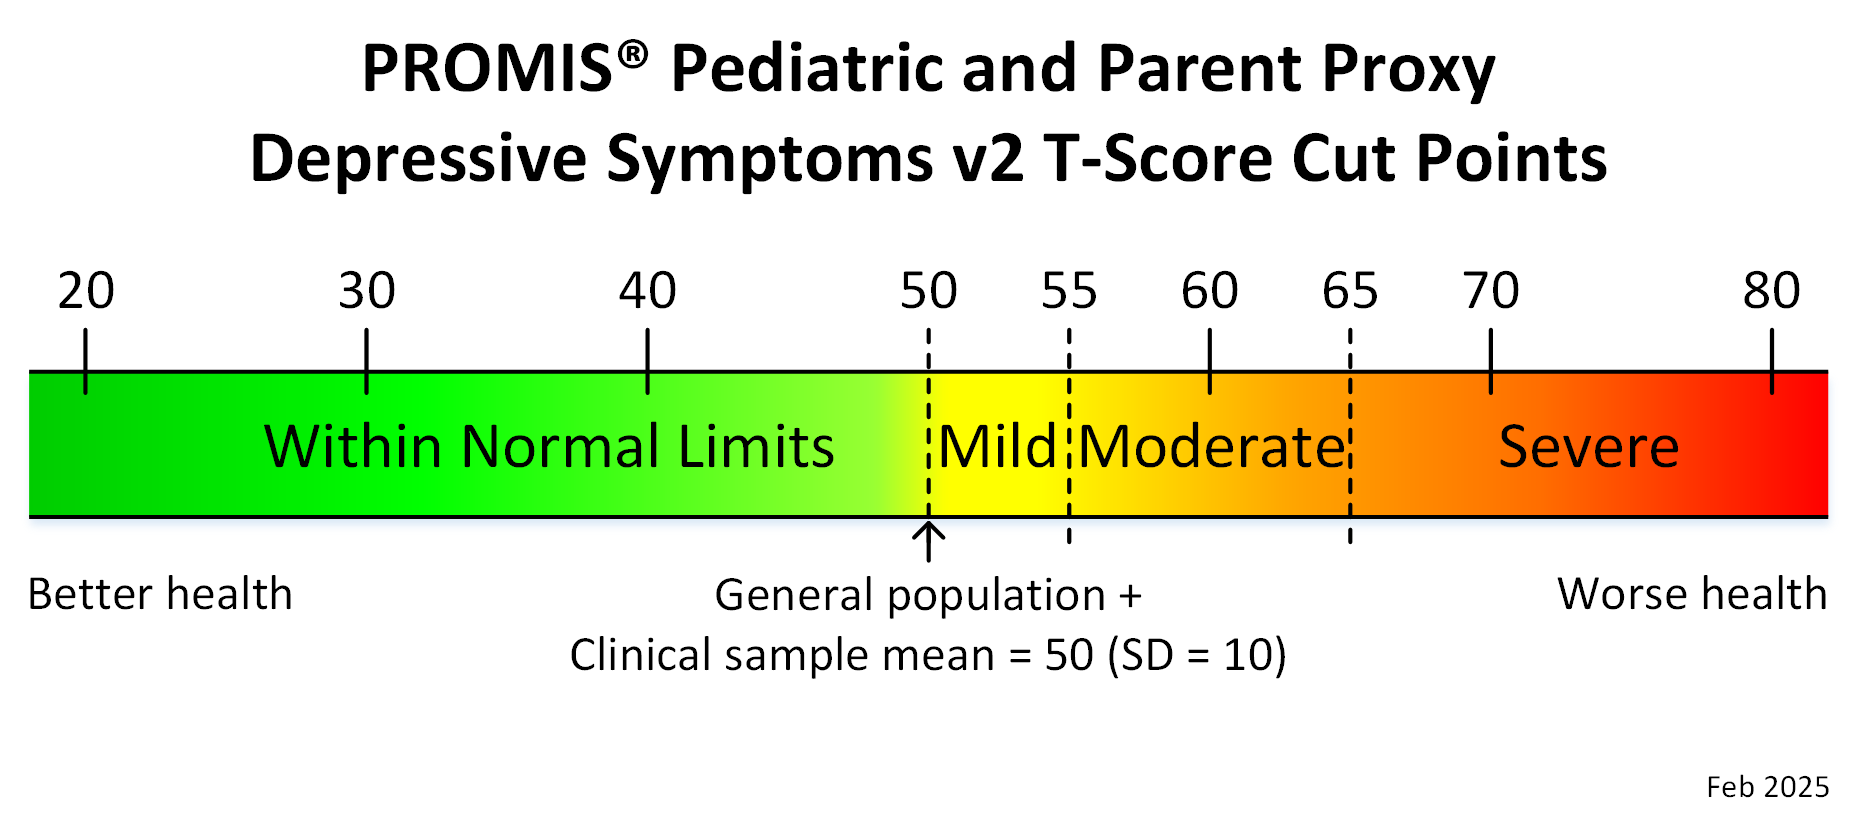
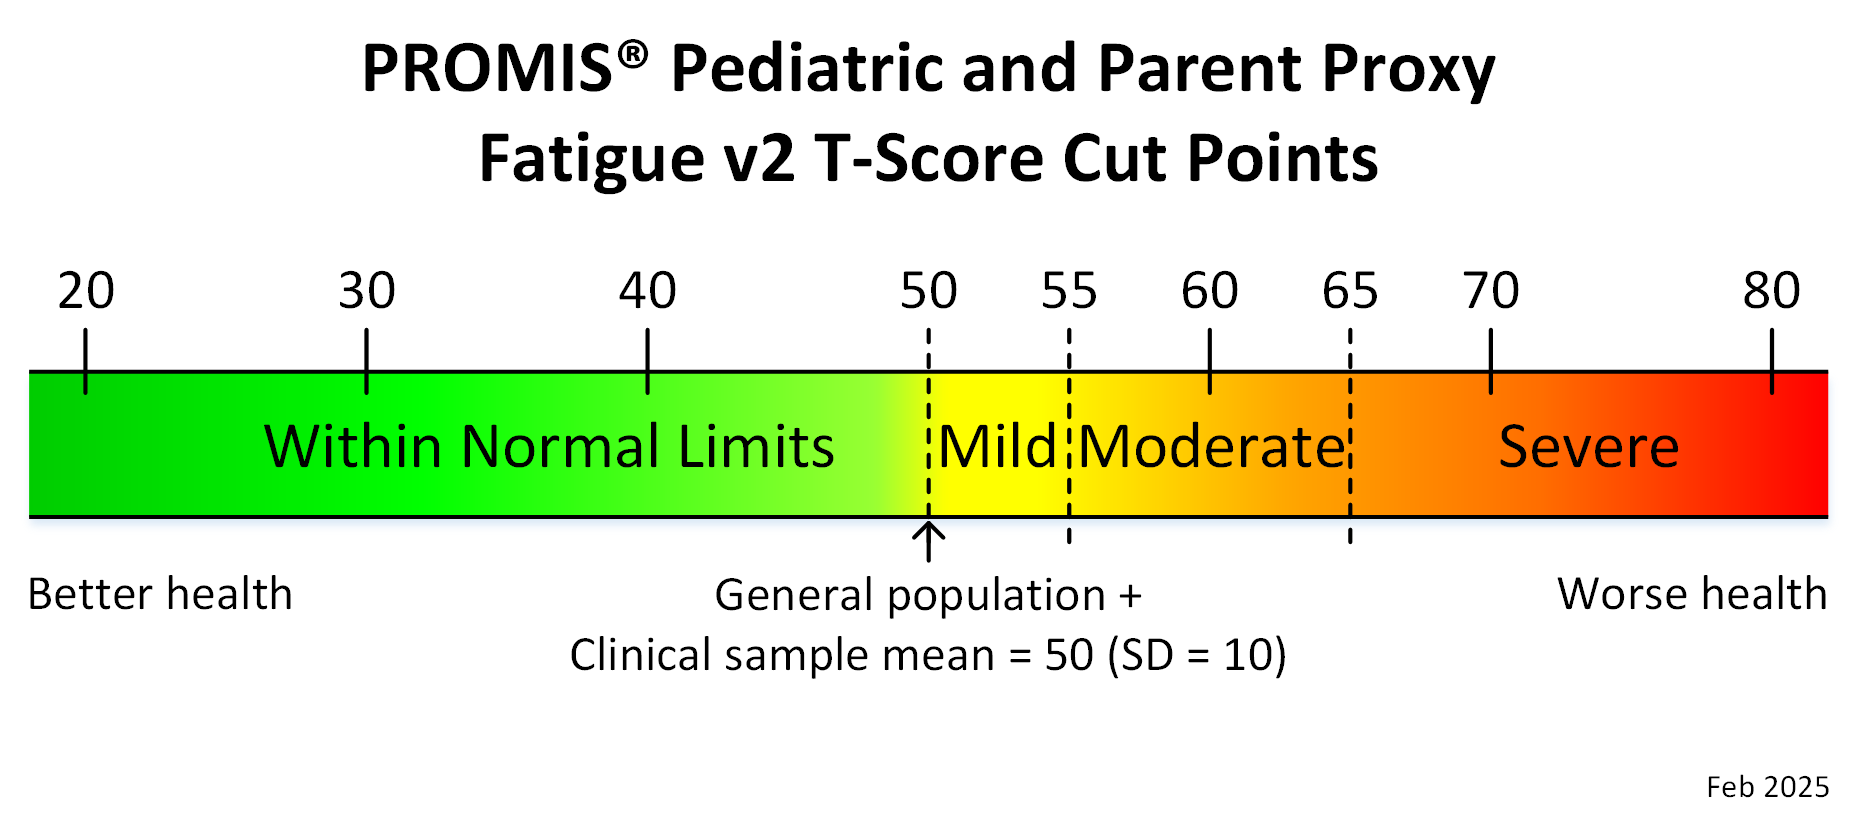
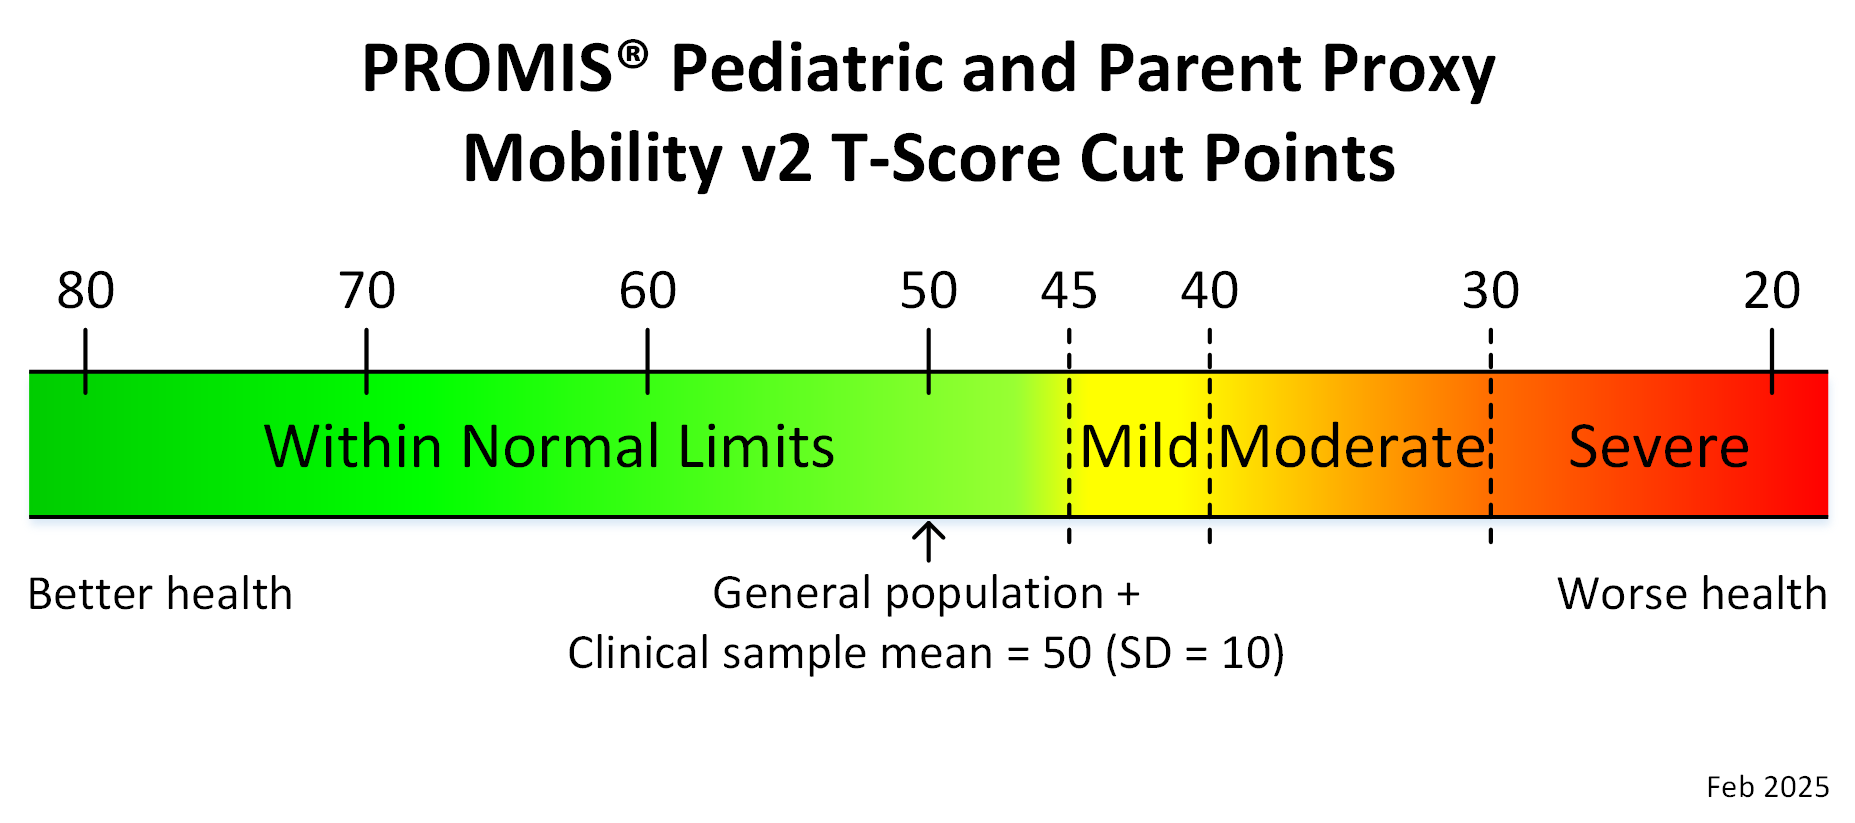
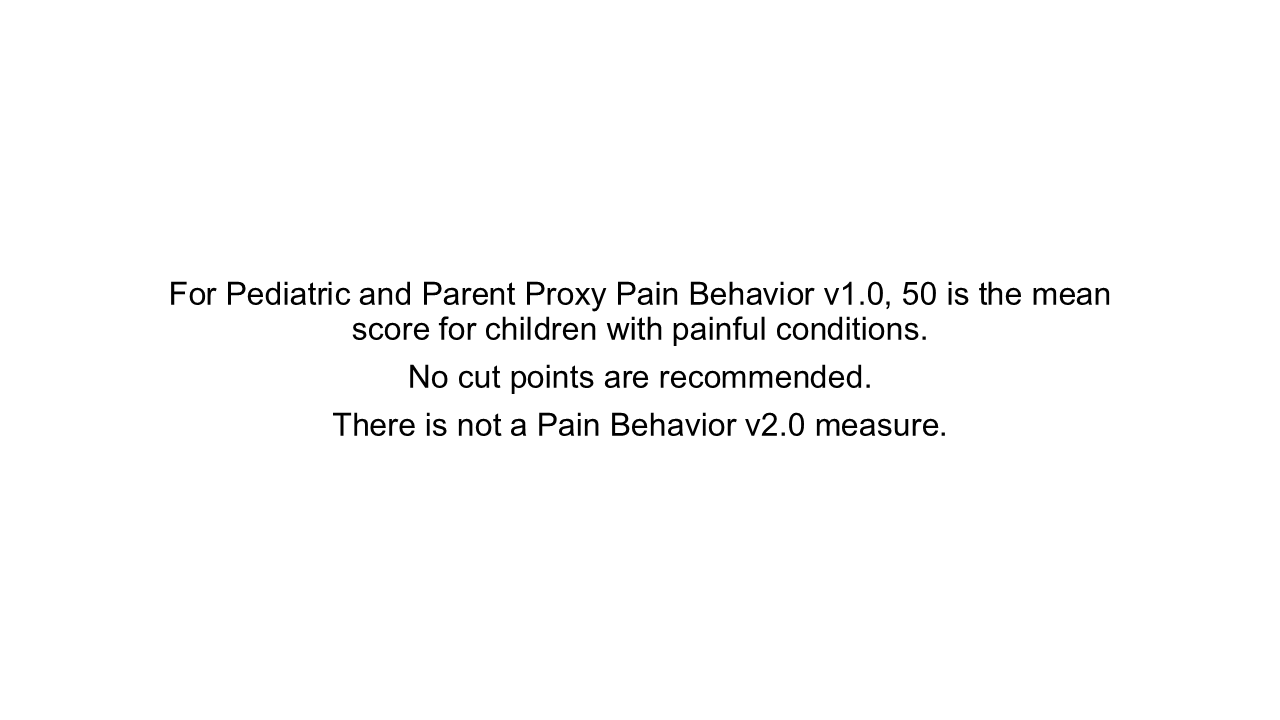
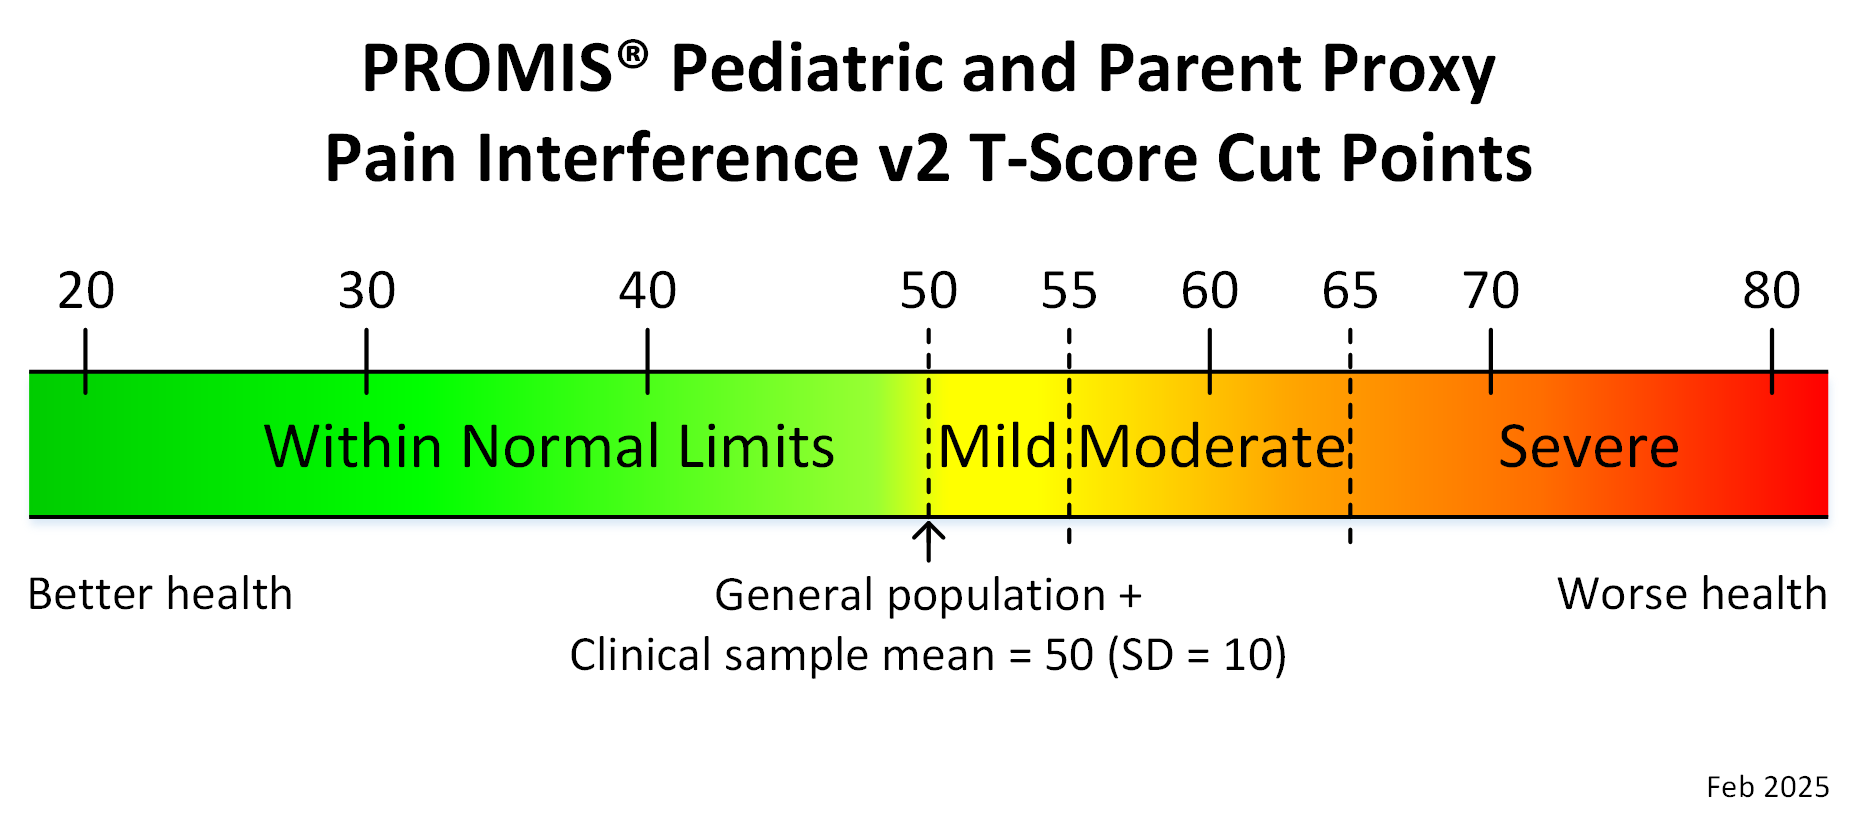
Contrast v2.0 and v3.0 PROMIS Pediatric and Parent Proxy Measures Score Cut Points
This figure shows how the PROMIS Pediatric and Parent Proxy v3.0 GenPop measures use different score cut points than the v2.0 measures.

Neuro-QoL™ Pediatric Measures

- Scores 0.5 – 1.0 SD worse than the mean = mild symptoms/impairment
- Scores 1.0 – 2.0 SD worse than the mean = moderate symptoms/impairment
- Scores 2.0 SD or more worse than the mean = severe symptoms/impairment
NIH Toolbox® Pediatric and Parent Report Measures
Instructions
- Identify whether the measure assesses negative or positive emotions.
- Apply the cut points below.
- Check the measure’s actual score range below to aid with interpretation.
Negative Emotion Measures
Anger, Apathy, Fear, Loneliness, Perceived Hostility, Perceived Rejection, Perceived Stress, Sadness
- T-scores below 60 = Within normal limits
- T-scores 60 and above = Potentially problematic
Positive Emotion Measures
Emotional Support, Empathic Behaviors, Friendship, Instrumental Support, Life Satisfaction, Meaning & Purpose, Positive Affect, Self-Efficacy
- T-scores above 40 = Within normal limits
- T-scores 40 and below = Potentially problematic
Score Ranges Vary
Due to test design, not all NIH Toolbox measures can produce the full range of T-scores. Some measures have:
- Limited low ranges: Cannot detect very low levels of symptoms.
- Limited high ranges: Cannot detect very high levels of symptoms.
Consequently:
- Scores at the extreme of a measure’s range should be interpreted with caution.
- Consider using multiple measures when comprehensive assessment is needed.
NIH Toolbox Score Ranges
Measure | Age Range | Scoring Table T-Score Range |
|---|---|---|
| NIH Toolbox Anger Fixed Form | 8-17 | 36.6 – 80.0 |
| NIH Toolbox Emotional Support CAT | 8-17 | 19.5 – 64.2 |
| NIH Toolbox Friendship CAT | 8-17 | 15.7 – 63.7 |
| NIH Toolbox General Life Satisfaction Fixed Form | 8-12 | 15.8 – 70.3 |
| NIH Toolbox Loneliness Fixed Form | 8-17 | 38.5 – 86.4 |
| NIH Toolbox Parent Report Anger Bank/Fixed Form | 8-12 | 35.0 – 87.1 |
| NIH Toolbox Parent Report Anger CAT | 3-7 | 36.4 – 88.6 |
| NIH Toolbox Parent Report Empathic Behaviors Bank/Fixed Form | 3-12 | 13.8 – 72.5 |
| NIH Toolbox Parent Report Fear – Over Anxious Fixed Form | 3-7 | 37.6 – 87.9 |
| NIH Toolbox Parent Report Fear – Separation Anxiety Fixed Form | 3-7 | 40.5 – 93.2 |
| NIH Toolbox Parent Report Fear CAT | 8-12 | 35.7 – 84.2 |
| NIH Toolbox Parent Report Perceived Stress CAT | 8-12 | 25.4 – 88.8 |
| NIH Toolbox Parent Report Positive Affect CAT | 3-7 | 11.9 – 63.7 |
| NIH Toolbox Parent Report Sadness CAT | 3-7 | 41.2 – 96.4 |
| NIH Toolbox Parent Report Sadness CAT | 8-12 | 41.5 – 92.9 |
| NIH Toolbox Perceived Hostility Fixed Form | 8-17 | 30.9 – 79.4 |
| NIH Toolbox Perceived Rejection Fixed Form | 8-17 | 37.5 – 82.6 |
| NIH Toolbox Perceived Stress CAT | 13-17 | 20.4 – 86.6 |
| NIH Toolbox Positive Affect CAT | 13-17 | 15.6 – 68.3 |
| NIH Toolbox Positive Affect CAT | 8-12 | 18.0 – 67.1 |
| NIH Toolbox Self-Efficacy CAT | 8-12 | 17.1 – 72.2 |
Last updated: September 30, 2026