

Interpret Scores

T-Scores
HealthMeasures have an average (mean) score of 50 and a standard deviation (SD) of 10.
HealthMeasures are scored as T-scores. T-scores are standardized scores similar to z-scores. A T-score transforms raw response scores into a scale with an average (mean) of 50 and standard deviation (SD) of 10. This makes interpreting a score easier because you can compare any score to the average.
Knowing how far away a respondent is from the mean can help you better understand their experience because you know how they are feeling compared to other people.
On the T-score metric:
- A score of 40 is one SD lower than the mean of the reference population (usually the general population).
- A score of 60 is one SD higher than the mean of the reference population (usually the general population).
Distribution of Scores
T-scores have a standard, bell-shaped distribution as shown in this figure. In a T-score distribution, we know what percent of people fall within specific score ranges.
- About 34% of people fall between the mean and one SD above the mean (T=50–60).
- About 14% of people fall between one and two SDs above the mean (T=60–70).
- About 2% of people fall more than two SDs above the mean (T=70+).
- The same percentages apply to scores below the mean.
- Together, this means that most people (68.4%) are within one SD above or below the mean (T=40–60).

Cumulative Percentiles
Because T-scores have a standard statistical distribution, you can calculate the cumulative percentile associated with any T-score. A cumulative percentile is the percent of people at or below a given score. For example, if you are at the 84th percentile, that means that out of 100 people, you scored higher than 84 of them. The cumulative percentiles for T-scores are shown in the Distribution of PROMIS Scores figure above. Specifically:
- 2.3% of people have a T-score of 30 or lower.
- 15.9% of people have a T-score of 40 or lower.
- 50% of people have a T-score of 50 or lower.
- 84.1% have a T-score of 60 or lower.
- 97.7% of people have a T-score of 70 or lower.
How to Calculate Percentiles
To calculate a cumulative percentile for a specific T-score, follow these two steps:
- Convert the T-score to a z-score.
- To do this, subtract 50 from your T-score. Then, divide by 10. That is: z-score = (T-score – 50) / 10
- Find a standard normal distribution table (z-table) or calculator. Locate your z-score and the corresponding percentile.
- You can find z-score tables and instructions at ztable.io.
- Using these tables, for example, you see that a z-score of -1.5 (a T-score of 35) reflects the 6.68 percentile.
Direction of Scores
A higher T-score means more of the concept being measured. This means a high score could reflect better or worse health, depending on the concept being measured.
- For negatively-worded concepts like fatigue, pain interference, and depression, a higher T-score represents more fatigue, pain interference, and depression (worse health). A lower T-score represents less fatigue, pain interference, and depression (better health).
- For positively-worded concepts like physical function, ability to participate, and cognitive function, a higher T-score represents more function and better health. A lower T-score represents less function and worse health.

The Score Cut Points pages show the direction of scores for HealthMeasures.
Calculate a Confidence Interval
Use the T-score and Standard Error (SE) to calculate a confidence interval. A 95% confidence interval is common. A 95% confidence interval means there is a 95% probability that the true T-score is within this range. The formula for a 95% confidence interval is:
T-score + (1.96*SE)
For example, if T=52 and SE=2, the lower boundary of the confidence interval is (52 – (1.96*2) = 48 and the upper boundary is (52 + (1.96*2) = 56. There is a 95% chance that the true score is between 48 and 56.
All Measure Types
All HealthMeasures T-scores are interpreted in the same way. This means that you can use a given domain’s interpretation tools for computer adaptive tests (CATs), short forms, and profiles that measure that domain.
Interpret Translations
Scores from translated HealthMeasures are interpreted just like English measures. This means that translated measures:
- Use T-scores.
- Have higher scores indicating more of the concept being measured.
- Use the same reference populations.
- Apply the same descriptive labels to ranges of scores (e.g., mild, moderate, severe). You can use translated terms (e.g., leve, moderado, intenso) with the respondent if appropriate.
- Use the same guidelines for interpreting changes in scores over time.
HealthMeasures Scores Have Meaning
Reference Populations
HealthMeasures scores are based on a specific, relevant group of people (e.g., general population, clinical population). That group is the reference population. Find the reference population for your measure.
Score Cut Points
Scores in specific ranges (e.g., 55-60, 60-70, 70+) reflect different levels of severity (e.g., mild, moderate, severe). These ranges are defined by score cut points.
Meaningful Change
Changes in scores (e.g., going from 45 to 50) must be of a certain magnitude to be considered meaningful. Learn about what degree of change is meaningful for your measure.
T-Score Maps
T-score Maps show the most likely response to PROMIS® items for every T-score. They describe what a score means through a set of items with responses. They can be used to train clinicians, set treatment goals, or set important thresholds.
G-Code Severity Modifiers
PROMIS and Neuro-QoL™ scores can be mapped to the G-code severity modifiers required by the Centers for Medicare and Medicaid (CMS).
Examples
Interpreting a PROMIS Physical Function T-Score
A patient’s PROMIS Physical Function T-score is 35 with a standard error (SE) of 2.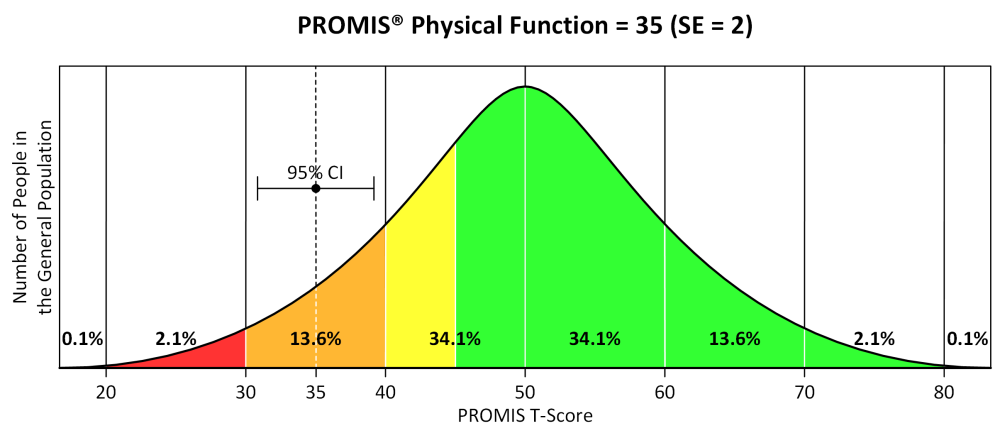
- This person’s score is 1½ standard deviations below the general population mean. In terms of PROMIS Physical Function, lower scores reflect less physical function. This means that this person is doing considerably worse than most people.
- See the direction of scores for all PROMIS measures at Score Cut Points.
- This score reflects moderate dysfunction.
- See the score ranges considered to be within normal limits, mild, moderate, and severe at Score Cut Points.
- This score is better than only about 6% of people in the general population.
- There is a 95% probability that this person’s true Physical Function T-score is between 31 and 39.
Interpreting a PROMIS Pain Interference T-Score
A patient’s PROMIS Pain Interference T-score is 60 with a standard error (SE) of 1.3.

- This person’s score is 1 standard deviation above the general population mean. For PROMIS Pain Interference, higher scores reflect more problems from pain. This means that this person is doing worse than most people.
- See the direction of scores for all PROMIS measures at Score Cut Points.
- This score is on the border between mild and moderate Pain Interference.
- See the score ranges considered to be within normal limits, mild, moderate, and severe at Score Cut Points.
- This score is worse than about 84% of people in the general population.
- There is a 95% probability that this person’s true Pain Interference T-score is between 57 and 63.
Learn How to Interpret PROMIS Scores
This four-minute video summarizes how to interpret PROMIS scores, including understanding T-scores, when higher scores are good or bad, reference populations, and score cut points.
Additional NIH Toolbox® Scores
NIH Toolbox uses Uncorrected T-scores and Age and Gender Corrected T-scores for Children. Knowing which scores you are using will help you interpret them correctly.
Uncorrected T-scores
- This score, provided for participants of all ages, compares the performance of the test-taker to those in the entire NIH Toolbox 2010 norming sample of nationally representative pediatric or adult (as appropriate) samples.
- The uncorrected T-score provides a normative score of the given participant’s overall performance when compared with that of the general U.S. population. For adults, this score is on a T-score metric (mean = 50, SD = 10).
- This score may be most useful when trying to gauge one’s overall level of functioning, not in the context of age, gender, or other demographic factors. It may also be of interest when monitoring performance over time.
Age and Gender Corrected T-scores for Children
- These are scores for children only (ages 3–17) in which corrections are made both for age and for gender. They are considered “fully corrected” because they are the factors that can lead to significantly and meaningfully different scores for these ages, based on analyses of the NIH Toolbox 2010 normative study data.
There are two main reasons for providing age and gender corrected scores for children completing NIH Toolbox Emotion measures: 1) different measures are used for different ages: parent report for ages 3–7, both parent report and self-report for ages 8–12, and only self-report for ages 13–17; and 2) it is not appropriate or desirable to use the same normative standards and expectations for boys and girls at different ages (as an extreme example, for a 3-year-old boy and a 17-year-old girl).
Last updated: September 14, 2026